Stock Analysis
- Japan
- /
- Trade Distributors
- /
- TSE:8074
Is Yuasa Trading Co., Ltd.'s (TSE:8074) Latest Stock Performance Being Led By Its Strong Fundamentals?


Most readers would already know that Yuasa Trading's (TSE:8074) stock increased by 9.5% over the past three months. Given that the market rewards strong financials in the long-term, we wonder if that is the case in this instance. Particularly, we will be paying attention to Yuasa Trading's ROE today.
Return on equity or ROE is a key measure used to assess how efficiently a company's management is utilizing the company's capital. Simply put, it is used to assess the profitability of a company in relation to its equity capital.
Check out our latest analysis for Yuasa Trading
How To Calculate Return On Equity?
Return on equity can be calculated by using the formula:
Return on Equity = Net Profit (from continuing operations) ÷ Shareholders' Equity
So, based on the above formula, the ROE for Yuasa Trading is:
13% = JP¥13b ÷ JP¥99b (Based on the trailing twelve months to December 2023).
The 'return' refers to a company's earnings over the last year. One way to conceptualize this is that for each ¥1 of shareholders' capital it has, the company made ¥0.13 in profit.
What Is The Relationship Between ROE And Earnings Growth?
Thus far, we have learned that ROE measures how efficiently a company is generating its profits. Based on how much of its profits the company chooses to reinvest or "retain", we are then able to evaluate a company's future ability to generate profits. Assuming all else is equal, companies that have both a higher return on equity and higher profit retention are usually the ones that have a higher growth rate when compared to companies that don't have the same features.
Yuasa Trading's Earnings Growth And 13% ROE
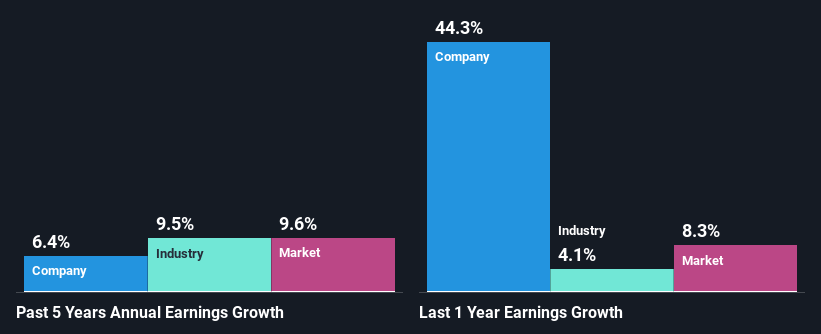
To begin with, Yuasa Trading seems to have a respectable ROE. On comparing with the average industry ROE of 8.1% the company's ROE looks pretty remarkable. This certainly adds some context to Yuasa Trading's decent 6.4% net income growth seen over the past five years.
Next, on comparing with the industry net income growth, we found that Yuasa Trading's reported growth was lower than the industry growth of 9.5% over the last few years, which is not something we like to see.
Earnings growth is an important metric to consider when valuing a stock. What investors need to determine next is if the expected earnings growth, or the lack of it, is already built into the share price. This then helps them determine if the stock is placed for a bright or bleak future. One good indicator of expected earnings growth is the P/E ratio which determines the price the market is willing to pay for a stock based on its earnings prospects. So, you may want to check if Yuasa Trading is trading on a high P/E or a low P/E, relative to its industry.
Is Yuasa Trading Using Its Retained Earnings Effectively?
Yuasa Trading has a three-year median payout ratio of 33%, which implies that it retains the remaining 67% of its profits. This suggests that its dividend is well covered, and given the decent growth seen by the company, it looks like management is reinvesting its earnings efficiently.
Besides, Yuasa Trading has been paying dividends for at least ten years or more. This shows that the company is committed to sharing profits with its shareholders.
Conclusion
In total, we are pretty happy with Yuasa Trading's performance. In particular, it's great to see that the company is investing heavily into its business and along with a high rate of return, that has resulted in a respectable growth in its earnings. If the company continues to grow its earnings the way it has, that could have a positive impact on its share price given how earnings per share influence long-term share prices. Remember, the price of a stock is also dependent on the perceived risk. Therefore investors must keep themselves informed about the risks involved before investing in any company. To know the 1 risk we have identified for Yuasa Trading visit our risks dashboard for free.
Valuation is complex, but we're helping make it simple.
Find out whether Yuasa Trading is potentially over or undervalued by checking out our comprehensive analysis, which includes fair value estimates, risks and warnings, dividends, insider transactions and financial health.
View the Free AnalysisHave feedback on this article? Concerned about the content? Get in touch with us directly. Alternatively, email editorial-team (at) simplywallst.com.
This article by Simply Wall St is general in nature. We provide commentary based on historical data and analyst forecasts only using an unbiased methodology and our articles are not intended to be financial advice. It does not constitute a recommendation to buy or sell any stock, and does not take account of your objectives, or your financial situation. We aim to bring you long-term focused analysis driven by fundamental data. Note that our analysis may not factor in the latest price-sensitive company announcements or qualitative material. Simply Wall St has no position in any stocks mentioned.
About TSE:8074
Yuasa Trading
Yuasa Trading Co., Ltd. engages in lifestyle and industry support business in Japan.
Solid track record with excellent balance sheet.
