- Japan
- /
- Electrical
- /
- TSE:6516
Sanyo Denki (TSE:6516) stock performs better than its underlying earnings growth over last five years


When we invest, we're generally looking for stocks that outperform the market average. Buying under-rated businesses is one path to excess returns. For example, the Sanyo Denki Co., Ltd. (TSE:6516) share price is up 83% in the last 5 years, clearly besting the market return of around 69% (ignoring dividends). However, more recent returns haven't been as impressive as that, with the stock returning just 11% in the last year, including dividends.
Since the stock has added JP¥7.3b to its market cap in the past week alone, let's see if underlying performance has been driving long-term returns.
View our latest analysis for Sanyo Denki
While the efficient markets hypothesis continues to be taught by some, it has been proven that markets are over-reactive dynamic systems, and investors are not always rational. One flawed but reasonable way to assess how sentiment around a company has changed is to compare the earnings per share (EPS) with the share price.
During five years of share price growth, Sanyo Denki achieved compound earnings per share (EPS) growth of 26% per year. This EPS growth is higher than the 13% average annual increase in the share price. Therefore, it seems the market has become relatively pessimistic about the company. The reasonably low P/E ratio of 10.93 also suggests market apprehension.
The graphic below depicts how EPS has changed over time (unveil the exact values by clicking on the image).
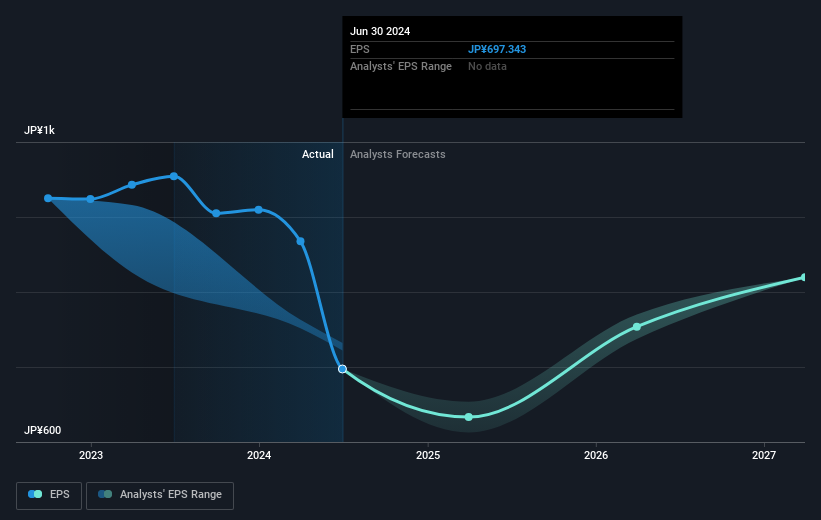
Before buying or selling a stock, we always recommend a close examination of historic growth trends, available here.
What About Dividends?
When looking at investment returns, it is important to consider the difference between total shareholder return (TSR) and share price return. The TSR is a return calculation that accounts for the value of cash dividends (assuming that any dividend received was reinvested) and the calculated value of any discounted capital raisings and spin-offs. Arguably, the TSR gives a more comprehensive picture of the return generated by a stock. In the case of Sanyo Denki, it has a TSR of 103% for the last 5 years. That exceeds its share price return that we previously mentioned. The dividends paid by the company have thusly boosted the total shareholder return.
A Different Perspective
Sanyo Denki shareholders are up 11% for the year (even including dividends). Unfortunately this falls short of the market return. It's probably a good sign that the company has an even better long term track record, having provided shareholders with an annual TSR of 15% over five years. It's quite possible the business continues to execute with prowess, even as the share price gains are slowing. While it is well worth considering the different impacts that market conditions can have on the share price, there are other factors that are even more important. For instance, we've identified 1 warning sign for Sanyo Denki that you should be aware of.
If you would prefer to check out another company -- one with potentially superior financials -- then do not miss this free list of companies that have proven they can grow earnings.
Please note, the market returns quoted in this article reflect the market weighted average returns of stocks that currently trade on Japanese exchanges.
New: Manage All Your Stock Portfolios in One Place
We've created the ultimate portfolio companion for stock investors, and it's free.
• Connect an unlimited number of Portfolios and see your total in one currency
• Be alerted to new Warning Signs or Risks via email or mobile
• Track the Fair Value of your stocks
Have feedback on this article? Concerned about the content? Get in touch with us directly. Alternatively, email editorial-team (at) simplywallst.com.
This article by Simply Wall St is general in nature. We provide commentary based on historical data and analyst forecasts only using an unbiased methodology and our articles are not intended to be financial advice. It does not constitute a recommendation to buy or sell any stock, and does not take account of your objectives, or your financial situation. We aim to bring you long-term focused analysis driven by fundamental data. Note that our analysis may not factor in the latest price-sensitive company announcements or qualitative material. Simply Wall St has no position in any stocks mentioned.
About TSE:6516
Sanyo Denki
Engages in cooling systems, power systems, servo systems, electrical equipment sales, and electrical works contracting businesses in Japan and internationally.
Flawless balance sheet average dividend payer.
