Stock Analysis
Has Okuma Corporation (TSE:6103) Stock's Recent Performance Got Anything to Do With Its Financial Health?

Okuma's (TSE:6103) stock up by 6.0% over the past three months. Given that stock prices are usually aligned with a company's financial performance in the long-term, we decided to investigate if the company's decent financials had a hand to play in the recent price move. Particularly, we will be paying attention to Okuma's ROE today.
ROE or return on equity is a useful tool to assess how effectively a company can generate returns on the investment it received from its shareholders. In short, ROE shows the profit each dollar generates with respect to its shareholder investments.
See our latest analysis for Okuma
How To Calculate Return On Equity?
The formula for ROE is:
Return on Equity = Net Profit (from continuing operations) ÷ Shareholders' Equity
So, based on the above formula, the ROE for Okuma is:
8.1% = JP¥18b ÷ JP¥227b (Based on the trailing twelve months to December 2023).
The 'return' refers to a company's earnings over the last year. So, this means that for every ¥1 of its shareholder's investments, the company generates a profit of ¥0.08.
What Is The Relationship Between ROE And Earnings Growth?
So far, we've learned that ROE is a measure of a company's profitability. We now need to evaluate how much profit the company reinvests or "retains" for future growth which then gives us an idea about the growth potential of the company. Assuming everything else remains unchanged, the higher the ROE and profit retention, the higher the growth rate of a company compared to companies that don't necessarily bear these characteristics.
Okuma's Earnings Growth And 8.1% ROE
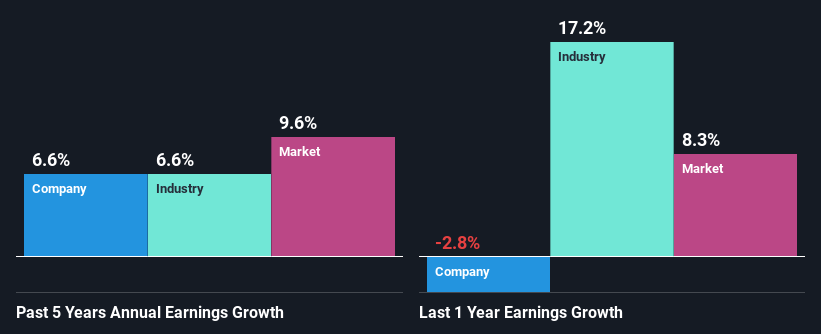
On the face of it, Okuma's ROE is not much to talk about. However, given that the company's ROE is similar to the average industry ROE of 7.5%, we may spare it some thought. Even so, Okuma has shown a fairly decent growth in its net income which grew at a rate of 6.6%. Given the slightly low ROE, it is likely that there could be some other aspects that are driving this growth. For example, it is possible that the company's management has made some good strategic decisions, or that the company has a low payout ratio.
Next, on comparing Okuma's net income growth with the industry, we found that the company's reported growth is similar to the industry average growth rate of 6.6% over the last few years.
The basis for attaching value to a company is, to a great extent, tied to its earnings growth. The investor should try to establish if the expected growth or decline in earnings, whichever the case may be, is priced in. This then helps them determine if the stock is placed for a bright or bleak future. What is 6103 worth today? The intrinsic value infographic in our free research report helps visualize whether 6103 is currently mispriced by the market.
Is Okuma Using Its Retained Earnings Effectively?
With a three-year median payout ratio of 29% (implying that the company retains 71% of its profits), it seems that Okuma is reinvesting efficiently in a way that it sees respectable amount growth in its earnings and pays a dividend that's well covered.
Additionally, Okuma has paid dividends over a period of at least ten years which means that the company is pretty serious about sharing its profits with shareholders.
Summary
In total, it does look like Okuma has some positive aspects to its business. Despite its low rate of return, the fact that the company reinvests a very high portion of its profits into its business, no doubt contributed to its high earnings growth. On studying current analyst estimates, we found that analysts expect the company to continue its recent growth streak. To know more about the latest analysts predictions for the company, check out this visualization of analyst forecasts for the company.
Valuation is complex, but we're helping make it simple.
Find out whether Okuma is potentially over or undervalued by checking out our comprehensive analysis, which includes fair value estimates, risks and warnings, dividends, insider transactions and financial health.
View the Free AnalysisHave feedback on this article? Concerned about the content? Get in touch with us directly. Alternatively, email editorial-team (at) simplywallst.com.
This article by Simply Wall St is general in nature. We provide commentary based on historical data and analyst forecasts only using an unbiased methodology and our articles are not intended to be financial advice. It does not constitute a recommendation to buy or sell any stock, and does not take account of your objectives, or your financial situation. We aim to bring you long-term focused analysis driven by fundamental data. Note that our analysis may not factor in the latest price-sensitive company announcements or qualitative material. Simply Wall St has no position in any stocks mentioned.
About TSE:6103
Okuma
Okuma Corporation manufactures and sells machine tools, NC controllers, FA products, and servo motors in Japan, the United States, rest of the Americas, Europe, China, and the Asia Pacific.
Flawless balance sheet and good value.
