Stock Analysis


One of the best investments we can make is in our own knowledge and skill set. With that in mind, this article will work through how we can use Return On Equity (ROE) to better understand a business. To keep the lesson grounded in practicality, we'll use ROE to better understand Snam S.p.A. (BIT:SRG).
Return on equity or ROE is an important factor to be considered by a shareholder because it tells them how effectively their capital is being reinvested. Simply put, it is used to assess the profitability of a company in relation to its equity capital.
Check out our latest analysis for Snam
How Do You Calculate Return On Equity?
The formula for return on equity is:
Return on Equity = Net Profit (from continuing operations) ÷ Shareholders' Equity
So, based on the above formula, the ROE for Snam is:
9.4% = €758m ÷ €8.0b (Based on the trailing twelve months to September 2023).
The 'return' is the income the business earned over the last year. Another way to think of that is that for every €1 worth of equity, the company was able to earn €0.09 in profit.
Does Snam Have A Good ROE?
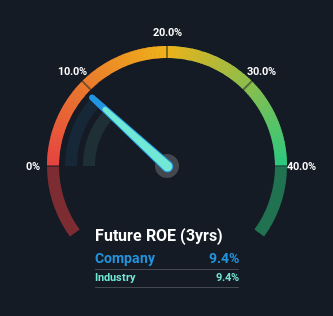
Arguably the easiest way to assess company's ROE is to compare it with the average in its industry. The limitation of this approach is that some companies are quite different from others, even within the same industry classification. The image below shows that Snam has an ROE that is roughly in line with the Gas Utilities industry average (9.4%).
That's neither particularly good, nor bad. Even if the ROE is respectable when compared to the industry, its worth checking if the firm's ROE is being aided by high debt levels. If so, this increases its exposure to financial risk. You can see the 3 risks we have identified for Snam by visiting our risks dashboard for free on our platform here.
The Importance Of Debt To Return On Equity
Companies usually need to invest money to grow their profits. That cash can come from retained earnings, issuing new shares (equity), or debt. In the first and second cases, the ROE will reflect this use of cash for investment in the business. In the latter case, the debt required for growth will boost returns, but will not impact the shareholders' equity. That will make the ROE look better than if no debt was used.
Combining Snam's Debt And Its 9.4% Return On Equity
It's worth noting the high use of debt by Snam, leading to its debt to equity ratio of 1.78. With a fairly low ROE, and significant use of debt, it's hard to get excited about this business at the moment. Debt does bring extra risk, so it's only really worthwhile when a company generates some decent returns from it.
Summary
Return on equity is a useful indicator of the ability of a business to generate profits and return them to shareholders. Companies that can achieve high returns on equity without too much debt are generally of good quality. All else being equal, a higher ROE is better.
Having said that, while ROE is a useful indicator of business quality, you'll have to look at a whole range of factors to determine the right price to buy a stock. The rate at which profits are likely to grow, relative to the expectations of profit growth reflected in the current price, must be considered, too. So you might want to take a peek at this data-rich interactive graph of forecasts for the company.
But note: Snam may not be the best stock to buy. So take a peek at this free list of interesting companies with high ROE and low debt.
Valuation is complex, but we're helping make it simple.
Find out whether Snam is potentially over or undervalued by checking out our comprehensive analysis, which includes fair value estimates, risks and warnings, dividends, insider transactions and financial health.
View the Free AnalysisHave feedback on this article? Concerned about the content? Get in touch with us directly. Alternatively, email editorial-team (at) simplywallst.com.
This article by Simply Wall St is general in nature. We provide commentary based on historical data and analyst forecasts only using an unbiased methodology and our articles are not intended to be financial advice. It does not constitute a recommendation to buy or sell any stock, and does not take account of your objectives, or your financial situation. We aim to bring you long-term focused analysis driven by fundamental data. Note that our analysis may not factor in the latest price-sensitive company announcements or qualitative material. Simply Wall St has no position in any stocks mentioned.
About BIT:SRG
Snam
Snam S.p.A., together with its subsidiaries, engages in the operation of natural gas transport and storage infrastructure.
Good value with proven track record and pays a dividend.
