Stock Analysis


Maps (BIT:MAPS) Full Year 2023 Results
Key Financial Results
- Revenue: €31.3m (up 18% from FY 2022).
- Net income: €924.6k (down 66% from FY 2022).
- Profit margin: 3.0% (down from 10% in FY 2022). The decrease in margin was driven by higher expenses.
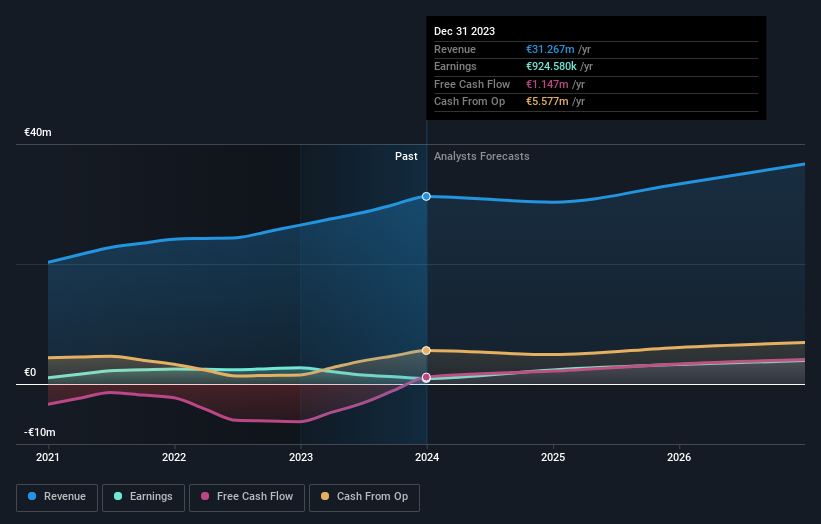
All figures shown in the chart above are for the trailing 12 month (TTM) period
Maps Earnings Insights
Looking ahead, revenue is forecast to grow 6.3% p.a. on average during the next 3 years, compared to a 11% growth forecast for the Software industry in Italy.
Performance of the Italian Software industry.
The company's shares are down 4.8% from a week ago.
Risk Analysis
Before you take the next step you should know about the 3 warning signs for Maps that we have uncovered.
Valuation is complex, but we're helping make it simple.
Find out whether Maps is potentially over or undervalued by checking out our comprehensive analysis, which includes fair value estimates, risks and warnings, dividends, insider transactions and financial health.
View the Free AnalysisHave feedback on this article? Concerned about the content? Get in touch with us directly. Alternatively, email editorial-team (at) simplywallst.com.
This article by Simply Wall St is general in nature. We provide commentary based on historical data and analyst forecasts only using an unbiased methodology and our articles are not intended to be financial advice. It does not constitute a recommendation to buy or sell any stock, and does not take account of your objectives, or your financial situation. We aim to bring you long-term focused analysis driven by fundamental data. Note that our analysis may not factor in the latest price-sensitive company announcements or qualitative material. Simply Wall St has no position in any stocks mentioned.
About BIT:MAPS
Maps
Maps S.p.A., a software solution provider, designs and develops technological solutions to support decision-making processes in public and private businesses and organizations.
Excellent balance sheet and good value.
