Stock Analysis
Pulling back 7.6% this week, Hampiðjan hf's ICE:HAMP) five-year decline in earnings may be coming into investors focus

Buying shares in the best businesses can build meaningful wealth for you and your family. While not every stock performs well, when investors win, they can win big. Just think about the savvy investors who held Hampiðjan hf. (ICE:HAMP) shares for the last five years, while they gained 306%. And this is just one example of the epic gains achieved by some long term investors. On top of that, the share price is up 18% in about a quarter. But this move may well have been assisted by the reasonably buoyant market (up 7.6% in 90 days).
In light of the stock dropping 7.6% in the past week, we want to investigate the longer term story, and see if fundamentals have been the driver of the company's positive five-year return.
View our latest analysis for Hampiðjan hf
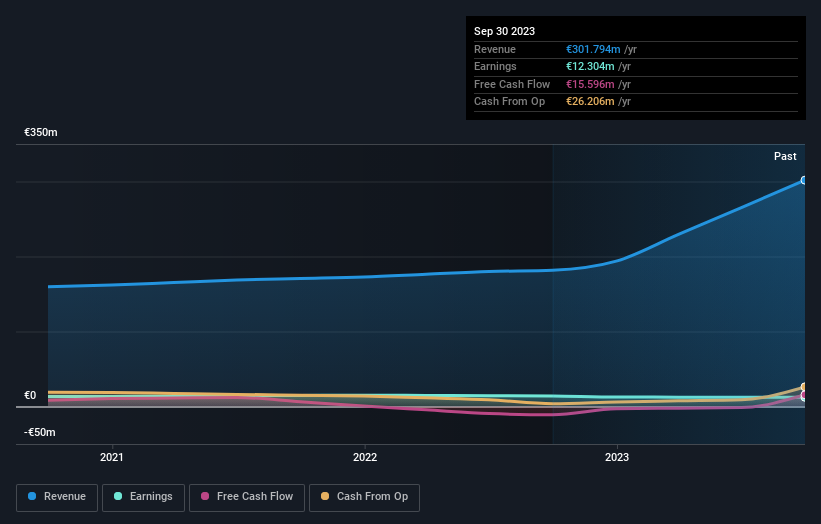
Given that Hampiðjan hf only made minimal earnings in the last twelve months, we'll focus on revenue to gauge its business development. Generally speaking, we'd consider a stock like this alongside loss-making companies, simply because the quantum of the profit is so low. It would be hard to believe in a more profitable future without growing revenues.
In the last 5 years Hampiðjan hf saw its revenue grow at 11% per year. That's a pretty good long term growth rate. However, the share price gain of 32% during the period is considerably stronger. It might not be cheap but a (long-term) growth stock like this is usually well worth taking a closer look at.
The graphic below depicts how earnings and revenue have changed over time (unveil the exact values by clicking on the image).
Take a more thorough look at Hampiðjan hf's financial health with this free report on its balance sheet.
What About Dividends?
It is important to consider the total shareholder return, as well as the share price return, for any given stock. Whereas the share price return only reflects the change in the share price, the TSR includes the value of dividends (assuming they were reinvested) and the benefit of any discounted capital raising or spin-off. Arguably, the TSR gives a more comprehensive picture of the return generated by a stock. As it happens, Hampiðjan hf's TSR for the last 5 years was 342%, which exceeds the share price return mentioned earlier. And there's no prize for guessing that the dividend payments largely explain the divergence!
A Different Perspective
It's good to see that Hampiðjan hf has rewarded shareholders with a total shareholder return of 7.9% in the last twelve months. That's including the dividend. However, that falls short of the 35% TSR per annum it has made for shareholders, each year, over five years. The pessimistic view would be that be that the stock has its best days behind it, but on the other hand the price might simply be moderating while the business itself continues to execute. While it is well worth considering the different impacts that market conditions can have on the share price, there are other factors that are even more important. To that end, you should be aware of the 3 warning signs we've spotted with Hampiðjan hf .
Of course, you might find a fantastic investment by looking elsewhere. So take a peek at this free list of companies we expect will grow earnings.
Please note, the market returns quoted in this article reflect the market weighted average returns of stocks that currently trade on Icelandic exchanges.
Valuation is complex, but we're helping make it simple.
Find out whether Hampiðjan hf is potentially over or undervalued by checking out our comprehensive analysis, which includes fair value estimates, risks and warnings, dividends, insider transactions and financial health.
View the Free AnalysisHave feedback on this article? Concerned about the content? Get in touch with us directly. Alternatively, email editorial-team (at) simplywallst.com.
This article by Simply Wall St is general in nature. We provide commentary based on historical data and analyst forecasts only using an unbiased methodology and our articles are not intended to be financial advice. It does not constitute a recommendation to buy or sell any stock, and does not take account of your objectives, or your financial situation. We aim to bring you long-term focused analysis driven by fundamental data. Note that our analysis may not factor in the latest price-sensitive company announcements or qualitative material. Simply Wall St has no position in any stocks mentioned.
About ICSE:HAMP
Hampiðjan hf
Hampiðjan hf. produces and sells fishing nets, ropes, and fishing long lines for the fishing fleet in Iceland.
Adequate balance sheet with questionable track record.
