Stock Analysis
ZIM Laboratories Limited's (NSE:ZIMLAB) Stock Has Seen Strong Momentum: Does That Call For Deeper Study Of Its Financial Prospects?


Most readers would already be aware that ZIM Laboratories' (NSE:ZIMLAB) stock increased significantly by 16% over the past week. As most would know, fundamentals are what usually guide market price movements over the long-term, so we decided to look at the company's key financial indicators today to determine if they have any role to play in the recent price movement. Particularly, we will be paying attention to ZIM Laboratories' ROE today.
Return on equity or ROE is a key measure used to assess how efficiently a company's management is utilizing the company's capital. In other words, it is a profitability ratio which measures the rate of return on the capital provided by the company's shareholders.
View our latest analysis for ZIM Laboratories
How Is ROE Calculated?
Return on equity can be calculated by using the formula:
Return on Equity = Net Profit (from continuing operations) ÷ Shareholders' Equity
So, based on the above formula, the ROE for ZIM Laboratories is:
7.3% = ₹164m ÷ ₹2.3b (Based on the trailing twelve months to December 2023).
The 'return' is the income the business earned over the last year. That means that for every ₹1 worth of shareholders' equity, the company generated ₹0.07 in profit.
What Has ROE Got To Do With Earnings Growth?
We have already established that ROE serves as an efficient profit-generating gauge for a company's future earnings. Depending on how much of these profits the company reinvests or "retains", and how effectively it does so, we are then able to assess a company’s earnings growth potential. Assuming everything else remains unchanged, the higher the ROE and profit retention, the higher the growth rate of a company compared to companies that don't necessarily bear these characteristics.
A Side By Side comparison of ZIM Laboratories' Earnings Growth And 7.3% ROE
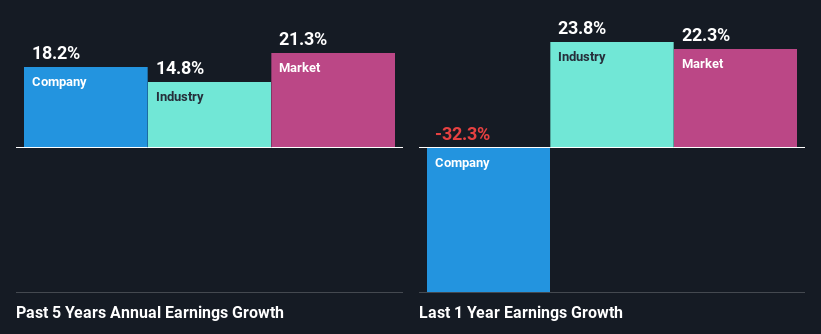
It is quite clear that ZIM Laboratories' ROE is rather low. Even when compared to the industry average of 13%, the ROE figure is pretty disappointing. Although, we can see that ZIM Laboratories saw a modest net income growth of 18% over the past five years. We reckon that there could be other factors at play here. For example, it is possible that the company's management has made some good strategic decisions, or that the company has a low payout ratio.
We then compared ZIM Laboratories' net income growth with the industry and we're pleased to see that the company's growth figure is higher when compared with the industry which has a growth rate of 15% in the same 5-year period.
Earnings growth is an important metric to consider when valuing a stock. It’s important for an investor to know whether the market has priced in the company's expected earnings growth (or decline). This then helps them determine if the stock is placed for a bright or bleak future. Is ZIM Laboratories fairly valued compared to other companies? These 3 valuation measures might help you decide.
Is ZIM Laboratories Making Efficient Use Of Its Profits?
ZIM Laboratories doesn't pay any regular dividends currently which essentially means that it has been reinvesting all of its profits into the business. This definitely contributes to the decent earnings growth number that we discussed above.
Conclusion
Overall, we feel that ZIM Laboratories certainly does have some positive factors to consider. Even in spite of the low rate of return, the company has posted impressive earnings growth as a result of reinvesting heavily into its business. While we won't completely dismiss the company, what we would do, is try to ascertain how risky the business is to make a more informed decision around the company. To know the 1 risk we have identified for ZIM Laboratories visit our risks dashboard for free.
Valuation is complex, but we're helping make it simple.
Find out whether ZIM Laboratories is potentially over or undervalued by checking out our comprehensive analysis, which includes fair value estimates, risks and warnings, dividends, insider transactions and financial health.
View the Free AnalysisHave feedback on this article? Concerned about the content? Get in touch with us directly. Alternatively, email editorial-team (at) simplywallst.com.
This article by Simply Wall St is general in nature. We provide commentary based on historical data and analyst forecasts only using an unbiased methodology and our articles are not intended to be financial advice. It does not constitute a recommendation to buy or sell any stock, and does not take account of your objectives, or your financial situation. We aim to bring you long-term focused analysis driven by fundamental data. Note that our analysis may not factor in the latest price-sensitive company announcements or qualitative material. Simply Wall St has no position in any stocks mentioned.
About NSEI:ZIMLAB
ZIM Laboratories
ZIM Laboratories Limited develops, manufactures, and supplies generic pharmaceutical and nutraceutical products in India and internationally.
Flawless balance sheet with questionable track record.
