Stock Analysis
AstraZeneca Pharma India (NSE:ASTRAZEN) jumps 4.5% this week, though earnings growth is still tracking behind five-year shareholder returns


AstraZeneca Pharma India Limited (NSE:ASTRAZEN) shareholders might be concerned after seeing the share price drop 14% in the last quarter. But in stark contrast, the returns over the last half decade have impressed. Indeed, the share price is up an impressive 132% in that time. To some, the recent pullback wouldn't be surprising after such a fast rise. Only time will tell if there is still too much optimism currently reflected in the share price.
On the back of a solid 7-day performance, let's check what role the company's fundamentals have played in driving long term shareholder returns.
See our latest analysis for AstraZeneca Pharma India
To quote Buffett, 'Ships will sail around the world but the Flat Earth Society will flourish. There will continue to be wide discrepancies between price and value in the marketplace...' By comparing earnings per share (EPS) and share price changes over time, we can get a feel for how investor attitudes to a company have morphed over time.
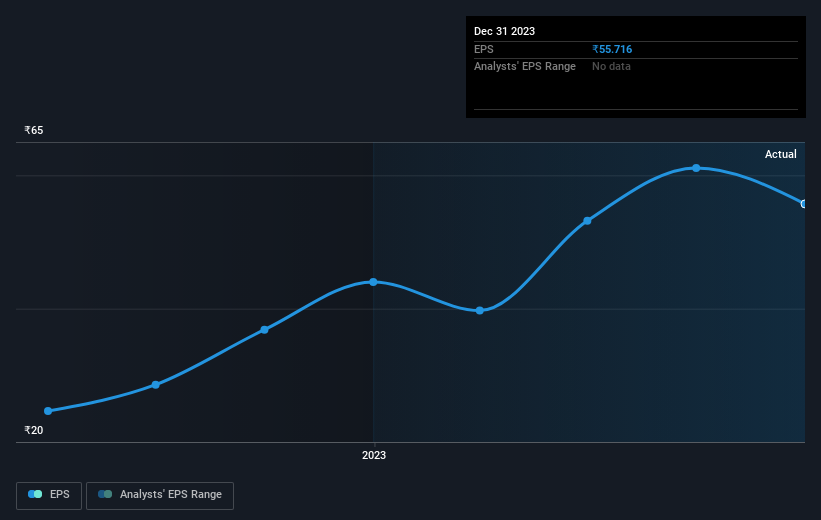
Over half a decade, AstraZeneca Pharma India managed to grow its earnings per share at 24% a year. The EPS growth is more impressive than the yearly share price gain of 18% over the same period. So one could conclude that the broader market has become more cautious towards the stock. Of course, with a P/E ratio of 97.19, the market remains optimistic.
You can see below how EPS has changed over time (discover the exact values by clicking on the image).
We're pleased to report that the CEO is remunerated more modestly than most CEOs at similarly capitalized companies. It's always worth keeping an eye on CEO pay, but a more important question is whether the company will grow earnings throughout the years. It might be well worthwhile taking a look at our free report on AstraZeneca Pharma India's earnings, revenue and cash flow.
What About Dividends?
As well as measuring the share price return, investors should also consider the total shareholder return (TSR). The TSR is a return calculation that accounts for the value of cash dividends (assuming that any dividend received was reinvested) and the calculated value of any discounted capital raisings and spin-offs. It's fair to say that the TSR gives a more complete picture for stocks that pay a dividend. As it happens, AstraZeneca Pharma India's TSR for the last 5 years was 134%, which exceeds the share price return mentioned earlier. The dividends paid by the company have thusly boosted the total shareholder return.
A Different Perspective
It's good to see that AstraZeneca Pharma India has rewarded shareholders with a total shareholder return of 71% in the last twelve months. And that does include the dividend. Since the one-year TSR is better than the five-year TSR (the latter coming in at 19% per year), it would seem that the stock's performance has improved in recent times. Given the share price momentum remains strong, it might be worth taking a closer look at the stock, lest you miss an opportunity. While it is well worth considering the different impacts that market conditions can have on the share price, there are other factors that are even more important. To that end, you should be aware of the 1 warning sign we've spotted with AstraZeneca Pharma India .
We will like AstraZeneca Pharma India better if we see some big insider buys. While we wait, check out this free list of growing companies with considerable, recent, insider buying.
Please note, the market returns quoted in this article reflect the market weighted average returns of stocks that currently trade on Indian exchanges.
Valuation is complex, but we're helping make it simple.
Find out whether AstraZeneca Pharma India is potentially over or undervalued by checking out our comprehensive analysis, which includes fair value estimates, risks and warnings, dividends, insider transactions and financial health.
View the Free AnalysisHave feedback on this article? Concerned about the content? Get in touch with us directly. Alternatively, email editorial-team (at) simplywallst.com.
This article by Simply Wall St is general in nature. We provide commentary based on historical data and analyst forecasts only using an unbiased methodology and our articles are not intended to be financial advice. It does not constitute a recommendation to buy or sell any stock, and does not take account of your objectives, or your financial situation. We aim to bring you long-term focused analysis driven by fundamental data. Note that our analysis may not factor in the latest price-sensitive company announcements or qualitative material. Simply Wall St has no position in any stocks mentioned.
About NSEI:ASTRAZEN
AstraZeneca Pharma India
AstraZeneca Pharma India Limited, a biopharmaceutical company, engages in manufacturing, distributing, and marketing of pharmaceutical products in India and internationally.
Outstanding track record with excellent balance sheet.
