Stock Analysis
Even though V.I.P. Industries (NSE:VIPIND) has lost ₹4.5b market cap in last 7 days, shareholders are still up 60% over 3 years


Investors can buy low cost index fund if they want to receive the average market return. But in any diversified portfolio of stocks, you'll see some that fall short of the average. That's what has happened with the V.I.P. Industries Limited (NSE:VIPIND) share price. It's up 57% over three years, but that is below the market return. Zooming in, the stock is actually down 17% in the last year.
In light of the stock dropping 5.6% in the past week, we want to investigate the longer term story, and see if fundamentals have been the driver of the company's positive three-year return.
See our latest analysis for V.I.P. Industries
While V.I.P. Industries made a small profit, in the last year, we think that the market is probably more focussed on the top line growth at the moment. As a general rule, we think this kind of company is more comparable to loss-making stocks, since the actual profit is so low. For shareholders to have confidence a company will grow profits significantly, it must grow revenue.
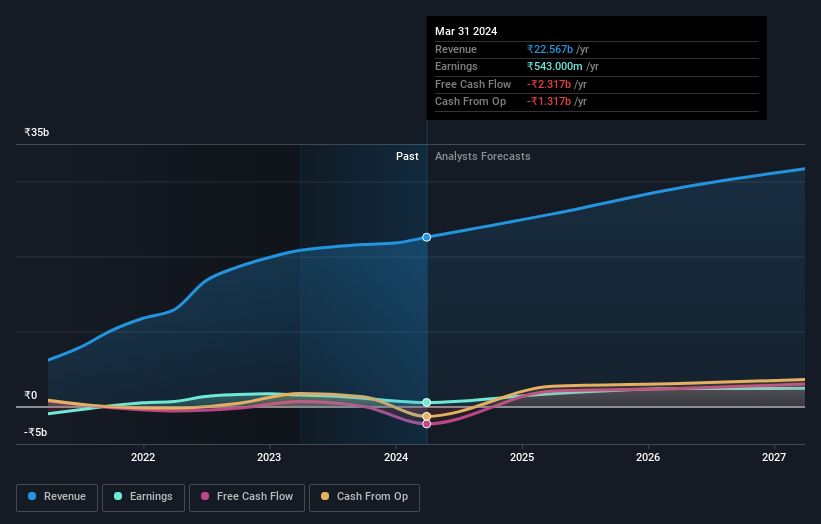
Over the last three years V.I.P. Industries has grown its revenue at 35% annually. That's well above most pre-profit companies. The stock is up 16% over that time - a decent but not impressive return. Generally, we would have hoped for a stronger share price, given the impressive revenue growth. If the business can trend towards profitability and fund its growth, then the market could present an opportunity. But if you're looking for growth stocks, there might be an opportunity here.
You can see how earnings and revenue have changed over time in the image below (click on the chart to see the exact values).
We like that insiders have been buying shares in the last twelve months. Even so, future earnings will be far more important to whether current shareholders make money. So we recommend checking out this free report showing consensus forecasts
What About Dividends?
When looking at investment returns, it is important to consider the difference between total shareholder return (TSR) and share price return. The TSR is a return calculation that accounts for the value of cash dividends (assuming that any dividend received was reinvested) and the calculated value of any discounted capital raisings and spin-offs. Arguably, the TSR gives a more comprehensive picture of the return generated by a stock. As it happens, V.I.P. Industries' TSR for the last 3 years was 60%, which exceeds the share price return mentioned earlier. And there's no prize for guessing that the dividend payments largely explain the divergence!
A Different Perspective
Investors in V.I.P. Industries had a tough year, with a total loss of 17% (including dividends), against a market gain of about 42%. However, keep in mind that even the best stocks will sometimes underperform the market over a twelve month period. Longer term investors wouldn't be so upset, since they would have made 5%, each year, over five years. If the fundamental data continues to indicate long term sustainable growth, the current sell-off could be an opportunity worth considering. It's always interesting to track share price performance over the longer term. But to understand V.I.P. Industries better, we need to consider many other factors. To that end, you should learn about the 4 warning signs we've spotted with V.I.P. Industries (including 2 which are a bit concerning) .
V.I.P. Industries is not the only stock that insiders are buying. For those who like to find winning investments this free list of growing companies with recent insider purchasing, could be just the ticket.
Please note, the market returns quoted in this article reflect the market weighted average returns of stocks that currently trade on Indian exchanges.
Valuation is complex, but we're helping make it simple.
Find out whether V.I.P. Industries is potentially over or undervalued by checking out our comprehensive analysis, which includes fair value estimates, risks and warnings, dividends, insider transactions and financial health.
View the Free AnalysisHave feedback on this article? Concerned about the content? Get in touch with us directly. Alternatively, email editorial-team (at) simplywallst.com.
This article by Simply Wall St is general in nature. We provide commentary based on historical data and analyst forecasts only using an unbiased methodology and our articles are not intended to be financial advice. It does not constitute a recommendation to buy or sell any stock, and does not take account of your objectives, or your financial situation. We aim to bring you long-term focused analysis driven by fundamental data. Note that our analysis may not factor in the latest price-sensitive company announcements or qualitative material. Simply Wall St has no position in any stocks mentioned.
About NSEI:VIPIND
V.I.P. Industries
Manufactures and sells luggage, backpacks, and accessories in India.
High growth potential second-rate dividend payer.

