Stock Analysis
Can Mixed Fundamentals Have A Negative Impact on Nandani Creation Limited (NSE:JAIPURKURT) Current Share Price Momentum?


Most readers would already be aware that Nandani Creation's (NSE:JAIPURKURT) stock increased significantly by 23% over the past week. However, we decided to pay attention to the company's fundamentals which don't appear to give a clear sign about the company's financial health. Specifically, we decided to study Nandani Creation's ROE in this article.
ROE or return on equity is a useful tool to assess how effectively a company can generate returns on the investment it received from its shareholders. In simpler terms, it measures the profitability of a company in relation to shareholder's equity.
View our latest analysis for Nandani Creation
How To Calculate Return On Equity?
The formula for return on equity is:
Return on Equity = Net Profit (from continuing operations) ÷ Shareholders' Equity
So, based on the above formula, the ROE for Nandani Creation is:
1.8% = ₹5.5m ÷ ₹299m (Based on the trailing twelve months to March 2024).
The 'return' is the yearly profit. That means that for every ₹1 worth of shareholders' equity, the company generated ₹0.02 in profit.
What Is The Relationship Between ROE And Earnings Growth?
Thus far, we have learned that ROE measures how efficiently a company is generating its profits. Depending on how much of these profits the company reinvests or "retains", and how effectively it does so, we are then able to assess a company’s earnings growth potential. Generally speaking, other things being equal, firms with a high return on equity and profit retention, have a higher growth rate than firms that don’t share these attributes.
A Side By Side comparison of Nandani Creation's Earnings Growth And 1.8% ROE
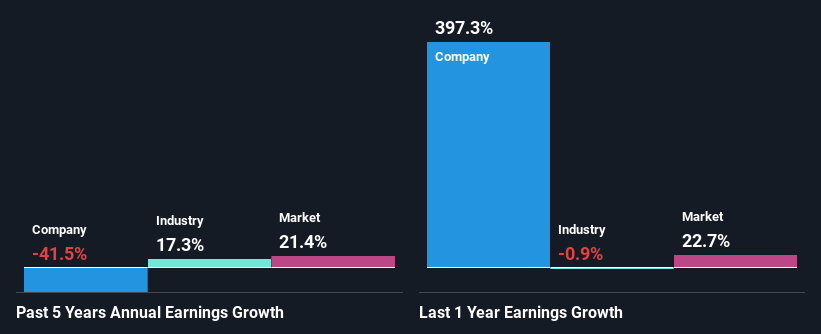
It is quite clear that Nandani Creation's ROE is rather low. Even when compared to the industry average of 7.5%, the ROE figure is pretty disappointing. Given the circumstances, the significant decline in net income by 41% seen by Nandani Creation over the last five years is not surprising. However, there could also be other factors causing the earnings to decline. For instance, the company has a very high payout ratio, or is faced with competitive pressures.
However, when we compared Nandani Creation's growth with the industry we found that while the company's earnings have been shrinking, the industry has seen an earnings growth of 17% in the same period. This is quite worrisome.
The basis for attaching value to a company is, to a great extent, tied to its earnings growth. The investor should try to establish if the expected growth or decline in earnings, whichever the case may be, is priced in. By doing so, they will have an idea if the stock is headed into clear blue waters or if swampy waters await. One good indicator of expected earnings growth is the P/E ratio which determines the price the market is willing to pay for a stock based on its earnings prospects. So, you may want to check if Nandani Creation is trading on a high P/E or a low P/E, relative to its industry.
Is Nandani Creation Using Its Retained Earnings Effectively?
Nandani Creation doesn't pay any regular dividends, meaning that potentially all of its profits are being reinvested in the business, which doesn't explain why the company's earnings have shrunk if it is retaining all of its profits. It looks like there might be some other reasons to explain the lack in that respect. For example, the business could be in decline.
Summary
In total, we're a bit ambivalent about Nandani Creation's performance. Even though it appears to be retaining most of its profits, given the low ROE, investors may not be benefitting from all that reinvestment after all. The low earnings growth suggests our theory correct. Wrapping up, we would proceed with caution with this company and one way of doing that would be to look at the risk profile of the business. You can see the 5 risks we have identified for Nandani Creation by visiting our risks dashboard for free on our platform here.
Valuation is complex, but we're helping make it simple.
Find out whether Nandani Creation is potentially over or undervalued by checking out our comprehensive analysis, which includes fair value estimates, risks and warnings, dividends, insider transactions and financial health.
View the Free AnalysisHave feedback on this article? Concerned about the content? Get in touch with us directly. Alternatively, email editorial-team (at) simplywallst.com.
This article by Simply Wall St is general in nature. We provide commentary based on historical data and analyst forecasts only using an unbiased methodology and our articles are not intended to be financial advice. It does not constitute a recommendation to buy or sell any stock, and does not take account of your objectives, or your financial situation. We aim to bring you long-term focused analysis driven by fundamental data. Note that our analysis may not factor in the latest price-sensitive company announcements or qualitative material. Simply Wall St has no position in any stocks mentioned.
About NSEI:JAIPURKURT
Nandani Creation
Manufactures, wholesales, trades, buys, sells, imports, and exports apparel in India and internationally.
Acceptable track record with mediocre balance sheet.

