Stock Analysis
Indo Count Industries' (NSE:ICIL) 61% CAGR outpaced the company's earnings growth over the same five-year period


Long term investing can be life changing when you buy and hold the truly great businesses. And highest quality companies can see their share prices grow by huge amounts. For example, the Indo Count Industries Limited (NSE:ICIL) share price is up a whopping 916% in the last half decade, a handsome return for long term holders. And this is just one example of the epic gains achieved by some long term investors. On top of that, the share price is up 44% in about a quarter. It really delights us to see such great share price performance for investors.
After a strong gain in the past week, it's worth seeing if longer term returns have been driven by improving fundamentals.
See our latest analysis for Indo Count Industries
There is no denying that markets are sometimes efficient, but prices do not always reflect underlying business performance. One way to examine how market sentiment has changed over time is to look at the interaction between a company's share price and its earnings per share (EPS).
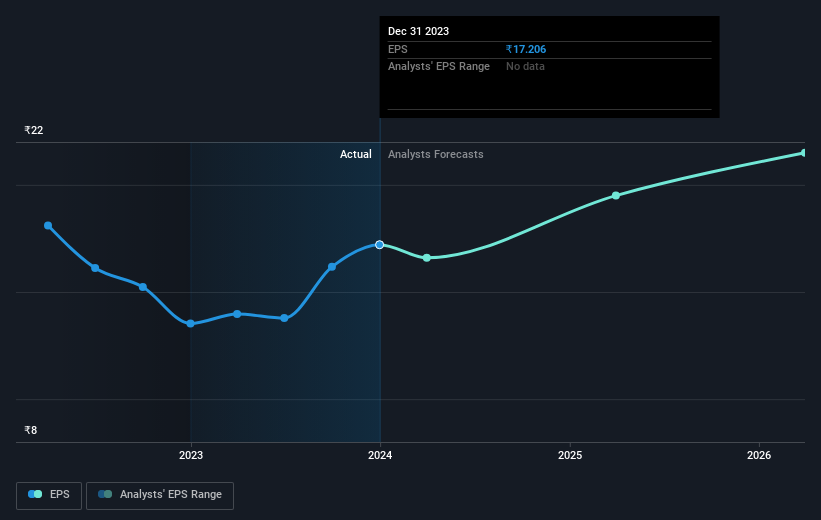
Over half a decade, Indo Count Industries managed to grow its earnings per share at 41% a year. This EPS growth is slower than the share price growth of 59% per year, over the same period. This suggests that market participants hold the company in higher regard, these days. That's not necessarily surprising considering the five-year track record of earnings growth.
The company's earnings per share (over time) is depicted in the image below (click to see the exact numbers).
We know that Indo Count Industries has improved its bottom line lately, but is it going to grow revenue? Check if analysts think Indo Count Industries will grow revenue in the future.
What About Dividends?
As well as measuring the share price return, investors should also consider the total shareholder return (TSR). The TSR is a return calculation that accounts for the value of cash dividends (assuming that any dividend received was reinvested) and the calculated value of any discounted capital raisings and spin-offs. It's fair to say that the TSR gives a more complete picture for stocks that pay a dividend. We note that for Indo Count Industries the TSR over the last 5 years was 979%, which is better than the share price return mentioned above. This is largely a result of its dividend payments!
A Different Perspective
It's nice to see that Indo Count Industries shareholders have received a total shareholder return of 202% over the last year. And that does include the dividend. Since the one-year TSR is better than the five-year TSR (the latter coming in at 61% per year), it would seem that the stock's performance has improved in recent times. In the best case scenario, this may hint at some real business momentum, implying that now could be a great time to delve deeper. It's always interesting to track share price performance over the longer term. But to understand Indo Count Industries better, we need to consider many other factors. To that end, you should be aware of the 1 warning sign we've spotted with Indo Count Industries .
If you would prefer to check out another company -- one with potentially superior financials -- then do not miss this free list of companies that have proven they can grow earnings.
Please note, the market returns quoted in this article reflect the market weighted average returns of stocks that currently trade on Indian exchanges.
Valuation is complex, but we're helping make it simple.
Find out whether Indo Count Industries is potentially over or undervalued by checking out our comprehensive analysis, which includes fair value estimates, risks and warnings, dividends, insider transactions and financial health.
View the Free AnalysisHave feedback on this article? Concerned about the content? Get in touch with us directly. Alternatively, email editorial-team (at) simplywallst.com.
This article by Simply Wall St is general in nature. We provide commentary based on historical data and analyst forecasts only using an unbiased methodology and our articles are not intended to be financial advice. It does not constitute a recommendation to buy or sell any stock, and does not take account of your objectives, or your financial situation. We aim to bring you long-term focused analysis driven by fundamental data. Note that our analysis may not factor in the latest price-sensitive company announcements or qualitative material. Simply Wall St has no position in any stocks mentioned.
About NSEI:ICIL
Indo Count Industries
Indo Count Industries Limited manufactures and sells home textile products in India.
Excellent balance sheet with proven track record.
