Stock Analysis
- India
- /
- Electrical
- /
- NSEI:BHEL
Bharat Heavy Electricals (NSE:BHEL) hikes 11% this week, taking five-year gains to 355%

For many, the main point of investing in the stock market is to achieve spectacular returns. And highest quality companies can see their share prices grow by huge amounts. Don't believe it? Then look at the Bharat Heavy Electricals Limited (NSE:BHEL) share price. It's 340% higher than it was five years ago. And this is just one example of the epic gains achieved by some long term investors. Also pleasing for shareholders was the 44% gain in the last three months.
Since the stock has added ₹108b to its market cap in the past week alone, let's see if underlying performance has been driving long-term returns.
View our latest analysis for Bharat Heavy Electricals
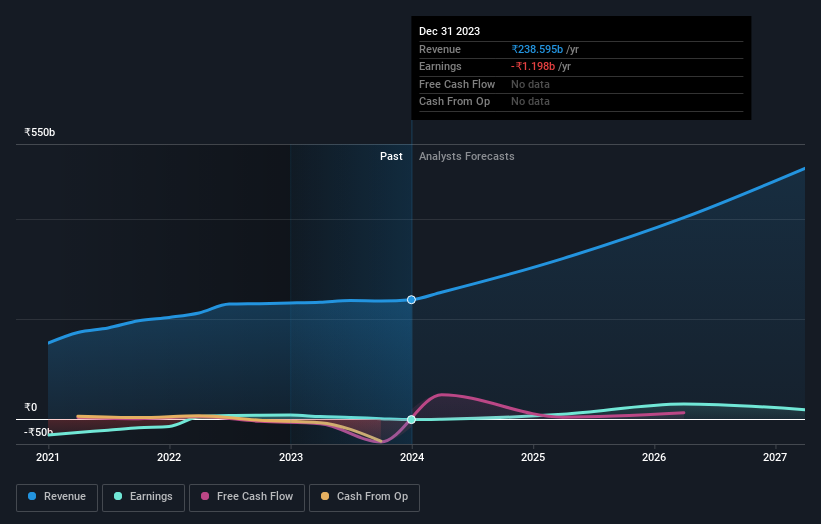
Given that Bharat Heavy Electricals didn't make a profit in the last twelve months, we'll focus on revenue growth to form a quick view of its business development. Generally speaking, companies without profits are expected to grow revenue every year, and at a good clip. As you can imagine, fast revenue growth, when maintained, often leads to fast profit growth.
In the last 5 years Bharat Heavy Electricals saw its revenue shrink by 2.5% per year. This is in stark contrast to the strong share price growth of 34%, compound, per year. Obviously, whatever the market is excited about, it's not a track record of revenue growth. I think it's fair to say there is probably a fair bit of excitement in the price.
You can see how earnings and revenue have changed over time in the image below (click on the chart to see the exact values).
Bharat Heavy Electricals is well known by investors, and plenty of clever analysts have tried to predict the future profit levels. You can see what analysts are predicting for Bharat Heavy Electricals in this interactive graph of future profit estimates.
What About Dividends?
It is important to consider the total shareholder return, as well as the share price return, for any given stock. Whereas the share price return only reflects the change in the share price, the TSR includes the value of dividends (assuming they were reinvested) and the benefit of any discounted capital raising or spin-off. Arguably, the TSR gives a more comprehensive picture of the return generated by a stock. In the case of Bharat Heavy Electricals, it has a TSR of 355% for the last 5 years. That exceeds its share price return that we previously mentioned. And there's no prize for guessing that the dividend payments largely explain the divergence!
A Different Perspective
We're pleased to report that Bharat Heavy Electricals shareholders have received a total shareholder return of 298% over one year. Of course, that includes the dividend. Since the one-year TSR is better than the five-year TSR (the latter coming in at 35% per year), it would seem that the stock's performance has improved in recent times. In the best case scenario, this may hint at some real business momentum, implying that now could be a great time to delve deeper. You might want to assess this data-rich visualization of its earnings, revenue and cash flow.
Of course, you might find a fantastic investment by looking elsewhere. So take a peek at this free list of companies we expect will grow earnings.
Please note, the market returns quoted in this article reflect the market weighted average returns of stocks that currently trade on Indian exchanges.
Valuation is complex, but we're helping make it simple.
Find out whether Bharat Heavy Electricals is potentially over or undervalued by checking out our comprehensive analysis, which includes fair value estimates, risks and warnings, dividends, insider transactions and financial health.
View the Free AnalysisHave feedback on this article? Concerned about the content? Get in touch with us directly. Alternatively, email editorial-team (at) simplywallst.com.
This article by Simply Wall St is general in nature. We provide commentary based on historical data and analyst forecasts only using an unbiased methodology and our articles are not intended to be financial advice. It does not constitute a recommendation to buy or sell any stock, and does not take account of your objectives, or your financial situation. We aim to bring you long-term focused analysis driven by fundamental data. Note that our analysis may not factor in the latest price-sensitive company announcements or qualitative material. Simply Wall St has no position in any stocks mentioned.
About NSEI:BHEL
Bharat Heavy Electricals
Operates as engineering and manufacturing company in India.
Reasonable growth potential with mediocre balance sheet.

