- India
- /
- Auto Components
- /
- NSEI:BHARATFORG
Investors Met With Slowing Returns on Capital At Bharat Forge (NSE:BHARATFORG)


Finding a business that has the potential to grow substantially is not easy, but it is possible if we look at a few key financial metrics. Typically, we'll want to notice a trend of growing return on capital employed (ROCE) and alongside that, an expanding base of capital employed. If you see this, it typically means it's a company with a great business model and plenty of profitable reinvestment opportunities. That's why when we briefly looked at Bharat Forge's (NSE:BHARATFORG) ROCE trend, we were pretty happy with what we saw.
Understanding Return On Capital Employed (ROCE)
For those that aren't sure what ROCE is, it measures the amount of pre-tax profits a company can generate from the capital employed in its business. To calculate this metric for Bharat Forge, this is the formula:
Return on Capital Employed = Earnings Before Interest and Tax (EBIT) ÷ (Total Assets - Current Liabilities)
0.18 = ₹19b ÷ (₹193b - ₹93b) (Based on the trailing twelve months to June 2024).
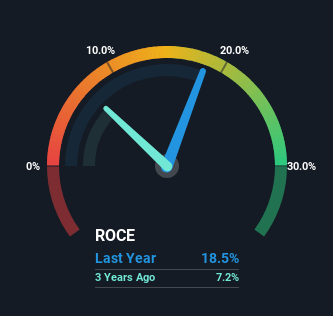
So, Bharat Forge has an ROCE of 18%. On its own, that's a standard return, however it's much better than the 15% generated by the Auto Components industry.
Check out our latest analysis for Bharat Forge
In the above chart we have measured Bharat Forge's prior ROCE against its prior performance, but the future is arguably more important. If you'd like, you can check out the forecasts from the analysts covering Bharat Forge for free.
So How Is Bharat Forge's ROCE Trending?
While the returns on capital are good, they haven't moved much. Over the past five years, ROCE has remained relatively flat at around 18% and the business has deployed 34% more capital into its operations. Since 18% is a moderate ROCE though, it's good to see a business can continue to reinvest at these decent rates of return. Over long periods of time, returns like these might not be too exciting, but with consistency they can pay off in terms of share price returns.
Another point to note, we noticed the company has increased current liabilities over the last five years. This is intriguing because if current liabilities hadn't increased to 48% of total assets, this reported ROCE would probably be less than18% because total capital employed would be higher.The 18% ROCE could be even lower if current liabilities weren't 48% of total assets, because the the formula would show a larger base of total capital employed. So with current liabilities at such high levels, this effectively means the likes of suppliers or short-term creditors are funding a meaningful part of the business, which in some instances can bring some risks.
In Conclusion...
To sum it up, Bharat Forge has simply been reinvesting capital steadily, at those decent rates of return. On top of that, the stock has rewarded shareholders with a remarkable 337% return to those who've held over the last five years. So even though the stock might be more "expensive" than it was before, we think the strong fundamentals warrant this stock for further research.
On a final note, we've found 2 warning signs for Bharat Forge that we think you should be aware of.
For those who like to invest in solid companies, check out this free list of companies with solid balance sheets and high returns on equity.
Valuation is complex, but we're here to simplify it.
Discover if Bharat Forge might be undervalued or overvalued with our detailed analysis, featuring fair value estimates, potential risks, dividends, insider trades, and its financial condition.
Access Free AnalysisHave feedback on this article? Concerned about the content? Get in touch with us directly. Alternatively, email editorial-team (at) simplywallst.com.
This article by Simply Wall St is general in nature. We provide commentary based on historical data and analyst forecasts only using an unbiased methodology and our articles are not intended to be financial advice. It does not constitute a recommendation to buy or sell any stock, and does not take account of your objectives, or your financial situation. We aim to bring you long-term focused analysis driven by fundamental data. Note that our analysis may not factor in the latest price-sensitive company announcements or qualitative material. Simply Wall St has no position in any stocks mentioned.
About NSEI:BHARATFORG
Bharat Forge
Engages in the manufacture and sale of forged and machined components in India and internationally.
High growth potential with solid track record.
