Stock Analysis
- India
- /
- Auto Components
- /
- NSEI:ASAHIINDIA
Asahi India Glass' (NSE:ASAHIINDIA) 21% CAGR outpaced the company's earnings growth over the same five-year period


When you buy a stock there is always a possibility that it could drop 100%. But on the bright side, you can make far more than 100% on a really good stock. Long term Asahi India Glass Limited (NSE:ASAHIINDIA) shareholders would be well aware of this, since the stock is up 154% in five years. It's also up 14% in about a month.
Since it's been a strong week for Asahi India Glass shareholders, let's have a look at trend of the longer term fundamentals.
Check out our latest analysis for Asahi India Glass
To paraphrase Benjamin Graham: Over the short term the market is a voting machine, but over the long term it's a weighing machine. One imperfect but simple way to consider how the market perception of a company has shifted is to compare the change in the earnings per share (EPS) with the share price movement.
Over half a decade, Asahi India Glass managed to grow its earnings per share at 10% a year. This EPS growth is slower than the share price growth of 21% per year, over the same period. This suggests that market participants hold the company in higher regard, these days. And that's hardly shocking given the track record of growth. This optimism is visible in its fairly high P/E ratio of 45.40.
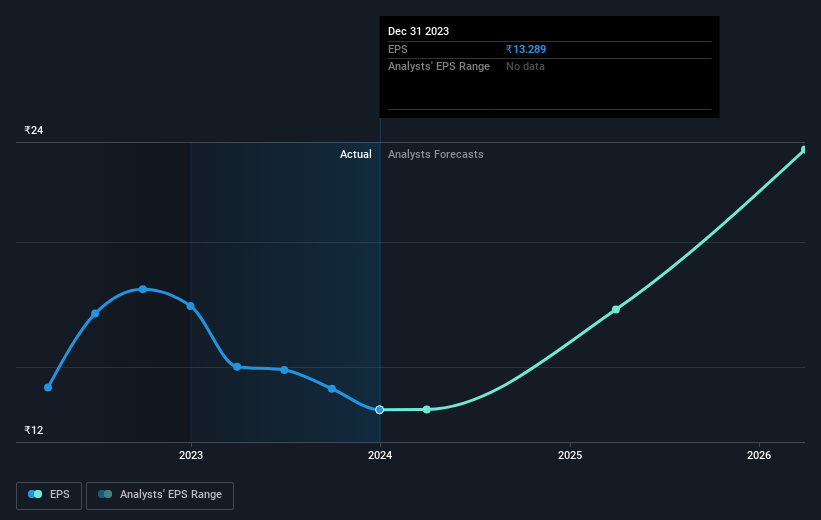
You can see below how EPS has changed over time (discover the exact values by clicking on the image).
We know that Asahi India Glass has improved its bottom line over the last three years, but what does the future have in store? If you are thinking of buying or selling Asahi India Glass stock, you should check out this FREE detailed report on its balance sheet.
What About Dividends?
It is important to consider the total shareholder return, as well as the share price return, for any given stock. The TSR is a return calculation that accounts for the value of cash dividends (assuming that any dividend received was reinvested) and the calculated value of any discounted capital raisings and spin-offs. It's fair to say that the TSR gives a more complete picture for stocks that pay a dividend. In the case of Asahi India Glass, it has a TSR of 159% for the last 5 years. That exceeds its share price return that we previously mentioned. The dividends paid by the company have thusly boosted the total shareholder return.
A Different Perspective
Asahi India Glass provided a TSR of 27% over the last twelve months. But that return falls short of the market. On the bright side, that's still a gain, and it's actually better than the average return of 21% over half a decade This suggests the company might be improving over time. It's always interesting to track share price performance over the longer term. But to understand Asahi India Glass better, we need to consider many other factors. Consider for instance, the ever-present spectre of investment risk. We've identified 3 warning signs with Asahi India Glass , and understanding them should be part of your investment process.
If you would prefer to check out another company -- one with potentially superior financials -- then do not miss this free list of companies that have proven they can grow earnings.
Please note, the market returns quoted in this article reflect the market weighted average returns of stocks that currently trade on Indian exchanges.
Valuation is complex, but we're helping make it simple.
Find out whether Asahi India Glass is potentially over or undervalued by checking out our comprehensive analysis, which includes fair value estimates, risks and warnings, dividends, insider transactions and financial health.
View the Free AnalysisHave feedback on this article? Concerned about the content? Get in touch with us directly. Alternatively, email editorial-team (at) simplywallst.com.
This article by Simply Wall St is general in nature. We provide commentary based on historical data and analyst forecasts only using an unbiased methodology and our articles are not intended to be financial advice. It does not constitute a recommendation to buy or sell any stock, and does not take account of your objectives, or your financial situation. We aim to bring you long-term focused analysis driven by fundamental data. Note that our analysis may not factor in the latest price-sensitive company announcements or qualitative material. Simply Wall St has no position in any stocks mentioned.
About NSEI:ASAHIINDIA
Asahi India Glass
Asahi India Glass Limited, an integrated glass and windows solutions company, manufactures and supplies various glass products in India and internationally.
Excellent balance sheet with reasonable growth potential.
