Stock Analysis
- Israel
- /
- Food and Staples Retail
- /
- TASE:HMAM
There's Been No Shortage Of Growth Recently For Hamama Meir Trading (1996)'s (TLV:HMAM) Returns On Capital

There are a few key trends to look for if we want to identify the next multi-bagger. Ideally, a business will show two trends; firstly a growing return on capital employed (ROCE) and secondly, an increasing amount of capital employed. Put simply, these types of businesses are compounding machines, meaning they are continually reinvesting their earnings at ever-higher rates of return. So on that note, Hamama Meir Trading (1996) (TLV:HMAM) looks quite promising in regards to its trends of return on capital.
Understanding Return On Capital Employed (ROCE)
Just to clarify if you're unsure, ROCE is a metric for evaluating how much pre-tax income (in percentage terms) a company earns on the capital invested in its business. To calculate this metric for Hamama Meir Trading (1996), this is the formula:
Return on Capital Employed = Earnings Before Interest and Tax (EBIT) ÷ (Total Assets - Current Liabilities)
0.052 = ₪5.0m ÷ (₪177m - ₪80m) (Based on the trailing twelve months to June 2023).
So, Hamama Meir Trading (1996) has an ROCE of 5.2%. In absolute terms, that's a low return and it also under-performs the Consumer Retailing industry average of 8.6%.
Check out our latest analysis for Hamama Meir Trading (1996)
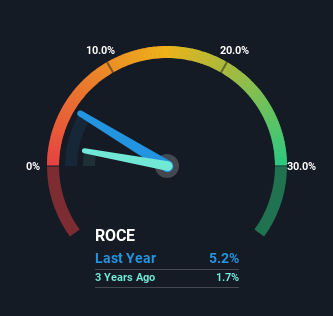
Historical performance is a great place to start when researching a stock so above you can see the gauge for Hamama Meir Trading (1996)'s ROCE against it's prior returns. If you're interested in investigating Hamama Meir Trading (1996)'s past further, check out this free graph of past earnings, revenue and cash flow.
What Can We Tell From Hamama Meir Trading (1996)'s ROCE Trend?
Hamama Meir Trading (1996) has not disappointed with their ROCE growth. The figures show that over the last five years, ROCE has grown 131% whilst employing roughly the same amount of capital. So it's likely that the business is now reaping the full benefits of its past investments, since the capital employed hasn't changed considerably. It's worth looking deeper into this though because while it's great that the business is more efficient, it might also mean that going forward the areas to invest internally for the organic growth are lacking.
On a separate but related note, it's important to know that Hamama Meir Trading (1996) has a current liabilities to total assets ratio of 45%, which we'd consider pretty high. This can bring about some risks because the company is basically operating with a rather large reliance on its suppliers or other sorts of short-term creditors. While it's not necessarily a bad thing, it can be beneficial if this ratio is lower.
What We Can Learn From Hamama Meir Trading (1996)'s ROCE
In summary, we're delighted to see that Hamama Meir Trading (1996) has been able to increase efficiencies and earn higher rates of return on the same amount of capital. And since the stock has fallen 20% over the last five years, there might be an opportunity here. With that in mind, we believe the promising trends warrant this stock for further investigation.
Hamama Meir Trading (1996) does come with some risks though, we found 4 warning signs in our investment analysis, and 1 of those is potentially serious...
While Hamama Meir Trading (1996) may not currently earn the highest returns, we've compiled a list of companies that currently earn more than 25% return on equity. Check out this free list here.
Valuation is complex, but we're helping make it simple.
Find out whether Hamama Meir Trading (1996) is potentially over or undervalued by checking out our comprehensive analysis, which includes fair value estimates, risks and warnings, dividends, insider transactions and financial health.
View the Free AnalysisHave feedback on this article? Concerned about the content? Get in touch with us directly. Alternatively, email editorial-team (at) simplywallst.com.
This article by Simply Wall St is general in nature. We provide commentary based on historical data and analyst forecasts only using an unbiased methodology and our articles are not intended to be financial advice. It does not constitute a recommendation to buy or sell any stock, and does not take account of your objectives, or your financial situation. We aim to bring you long-term focused analysis driven by fundamental data. Note that our analysis may not factor in the latest price-sensitive company announcements or qualitative material. Simply Wall St has no position in any stocks mentioned.
About TASE:HMAM
Hamama Meir Trading (1996)
Hamama Meir Trading (1996) Ltd. engages in the import and distribution of raw materials for the food industry in Israel.
Excellent balance sheet with acceptable track record.
