Stock Analysis
- Israel
- /
- Electrical
- /
- TASE:APLP
Investors ignore increasing losses at Apollo Power (TLV:APLP) as stock jumps 11% this past week


We think all investors should try to buy and hold high quality multi-year winners. While not every stock performs well, when investors win, they can win big. Don't believe it? Then look at the Apollo Power Ltd (TLV:APLP) share price. It's 546% higher than it was five years ago. If that doesn't get you thinking about long term investing, we don't know what will. It's also good to see the share price up 27% over the last quarter. We love happy stories like this one. The company should be really proud of that performance!
The past week has proven to be lucrative for Apollo Power investors, so let's see if fundamentals drove the company's five-year performance.
See our latest analysis for Apollo Power
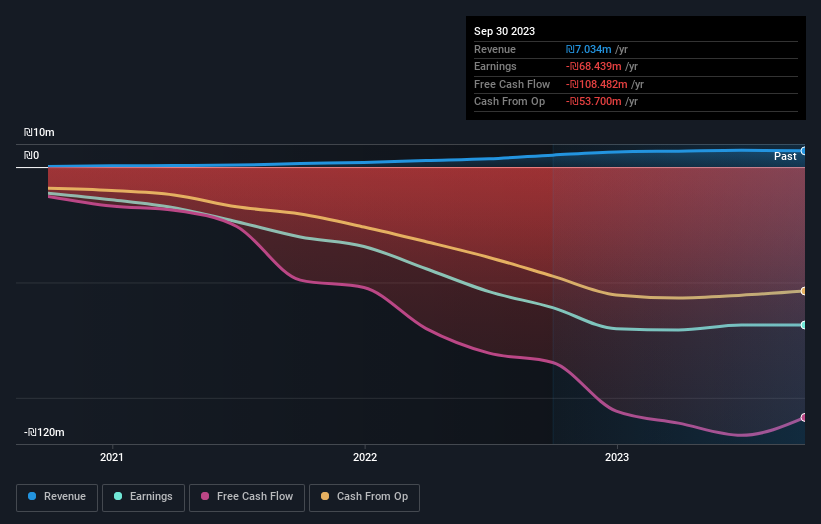
Apollo Power wasn't profitable in the last twelve months, it is unlikely we'll see a strong correlation between its share price and its earnings per share (EPS). Arguably revenue is our next best option. Shareholders of unprofitable companies usually desire strong revenue growth. That's because it's hard to be confident a company will be sustainable if revenue growth is negligible, and it never makes a profit.
For the last half decade, Apollo Power can boast revenue growth at a rate of 73% per year. That's well above most pre-profit companies. Arguably, this is well and truly reflected in the strong share price gain of 45%(per year) over the same period. It's never too late to start following a top notch stock like Apollo Power, since some long term winners go on winning for decades. So we'd recommend you take a closer look at this one, but keep in mind the market seems optimistic.
The image below shows how earnings and revenue have tracked over time (if you click on the image you can see greater detail).
Balance sheet strength is crucial. It might be well worthwhile taking a look at our free report on how its financial position has changed over time.
What About The Total Shareholder Return (TSR)?
Investors should note that there's a difference between Apollo Power's total shareholder return (TSR) and its share price change, which we've covered above. The TSR attempts to capture the value of dividends (as if they were reinvested) as well as any spin-offs or discounted capital raisings offered to shareholders. We note that Apollo Power's TSR, at 584% is higher than its share price return of 546%. When you consider it hasn't been paying a dividend, this data suggests shareholders have benefitted from a spin-off, or had the opportunity to acquire attractively priced shares in a discounted capital raising.
A Different Perspective
While the broader market gained around 15% in the last year, Apollo Power shareholders lost 52%. However, keep in mind that even the best stocks will sometimes underperform the market over a twelve month period. On the bright side, long term shareholders have made money, with a gain of 47% per year over half a decade. It could be that the recent sell-off is an opportunity, so it may be worth checking the fundamental data for signs of a long term growth trend. It's always interesting to track share price performance over the longer term. But to understand Apollo Power better, we need to consider many other factors. Consider for instance, the ever-present spectre of investment risk. We've identified 6 warning signs with Apollo Power (at least 3 which are a bit unpleasant) , and understanding them should be part of your investment process.
If you would prefer to check out another company -- one with potentially superior financials -- then do not miss this free list of companies that have proven they can grow earnings.
Please note, the market returns quoted in this article reflect the market weighted average returns of stocks that currently trade on Israeli exchanges.
Valuation is complex, but we're helping make it simple.
Find out whether Apollo Power is potentially over or undervalued by checking out our comprehensive analysis, which includes fair value estimates, risks and warnings, dividends, insider transactions and financial health.
View the Free AnalysisHave feedback on this article? Concerned about the content? Get in touch with us directly. Alternatively, email editorial-team (at) simplywallst.com.
This article by Simply Wall St is general in nature. We provide commentary based on historical data and analyst forecasts only using an unbiased methodology and our articles are not intended to be financial advice. It does not constitute a recommendation to buy or sell any stock, and does not take account of your objectives, or your financial situation. We aim to bring you long-term focused analysis driven by fundamental data. Note that our analysis may not factor in the latest price-sensitive company announcements or qualitative material. Simply Wall St has no position in any stocks mentioned.
About TASE:APLP
Apollo Power
Apollo Power Ltd provides technology solutions for manufacturing energy films in Israel.
Mediocre balance sheet with weak fundamentals.
