Stock Analysis
Investing in Israel Discount Bank (TLV:DSCT) five years ago would have delivered you a 53% gain


When we invest, we're generally looking for stocks that outperform the market average. And while active stock picking involves risks (and requires diversification) it can also provide excess returns. For example, long term Israel Discount Bank Limited (TLV:DSCT) shareholders have enjoyed a 38% share price rise over the last half decade, well in excess of the market return of around 24% (not including dividends). However, more recent returns haven't been as impressive as that, with the stock returning just 7.5% in the last year , including dividends .
So let's assess the underlying fundamentals over the last 5 years and see if they've moved in lock-step with shareholder returns.
View our latest analysis for Israel Discount Bank
To quote Buffett, 'Ships will sail around the world but the Flat Earth Society will flourish. There will continue to be wide discrepancies between price and value in the marketplace...' One flawed but reasonable way to assess how sentiment around a company has changed is to compare the earnings per share (EPS) with the share price.
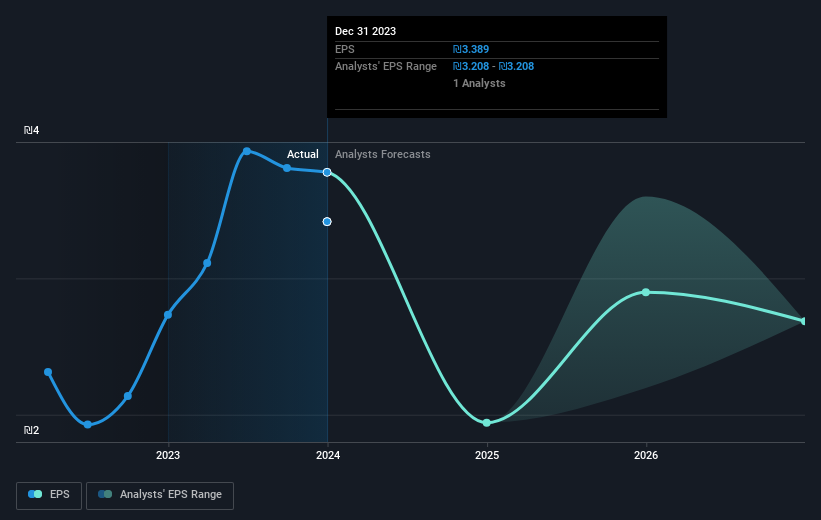
During five years of share price growth, Israel Discount Bank achieved compound earnings per share (EPS) growth of 21% per year. This EPS growth is higher than the 7% average annual increase in the share price. So one could conclude that the broader market has become more cautious towards the stock. The reasonably low P/E ratio of 5.60 also suggests market apprehension.
The image below shows how EPS has tracked over time (if you click on the image you can see greater detail).
We know that Israel Discount Bank has improved its bottom line over the last three years, but what does the future have in store? You can see how its balance sheet has strengthened (or weakened) over time in this free interactive graphic.
What About Dividends?
It is important to consider the total shareholder return, as well as the share price return, for any given stock. The TSR is a return calculation that accounts for the value of cash dividends (assuming that any dividend received was reinvested) and the calculated value of any discounted capital raisings and spin-offs. It's fair to say that the TSR gives a more complete picture for stocks that pay a dividend. As it happens, Israel Discount Bank's TSR for the last 5 years was 53%, which exceeds the share price return mentioned earlier. The dividends paid by the company have thusly boosted the total shareholder return.
A Different Perspective
Israel Discount Bank shareholders are up 7.5% for the year (even including dividends). But that was short of the market average. On the bright side, the longer term returns (running at about 9% a year, over half a decade) look better. It's quite possible the business continues to execute with prowess, even as the share price gains are slowing. It's always interesting to track share price performance over the longer term. But to understand Israel Discount Bank better, we need to consider many other factors. To that end, you should learn about the 2 warning signs we've spotted with Israel Discount Bank (including 1 which is significant) .
If you would prefer to check out another company -- one with potentially superior financials -- then do not miss this free list of companies that have proven they can grow earnings.
Please note, the market returns quoted in this article reflect the market weighted average returns of stocks that currently trade on Israeli exchanges.
Valuation is complex, but we're helping make it simple.
Find out whether Israel Discount Bank is potentially over or undervalued by checking out our comprehensive analysis, which includes fair value estimates, risks and warnings, dividends, insider transactions and financial health.
View the Free AnalysisHave feedback on this article? Concerned about the content? Get in touch with us directly. Alternatively, email editorial-team (at) simplywallst.com.
This article by Simply Wall St is general in nature. We provide commentary based on historical data and analyst forecasts only using an unbiased methodology and our articles are not intended to be financial advice. It does not constitute a recommendation to buy or sell any stock, and does not take account of your objectives, or your financial situation. We aim to bring you long-term focused analysis driven by fundamental data. Note that our analysis may not factor in the latest price-sensitive company announcements or qualitative material. Simply Wall St has no position in any stocks mentioned.
About TASE:DSCT
Israel Discount Bank
Provides various banking and financial services in Israel, Europe, and North America.
Very undervalued with flawless balance sheet.

