Stock Analysis
- Hungary
- /
- Real Estate
- /
- BUSE:DUNAHOUSE
Duna House Holding Nyrt's (BUSE:DUNAHOUSE) three-year earnings growth trails the 38% YoY shareholder returns


By buying an index fund, you can roughly match the market return with ease. But if you buy good businesses at attractive prices, your portfolio returns could exceed the average market return. For example, the Duna House Holding Nyrt. (BUSE:DUNAHOUSE) share price is up 93% in the last three years, clearly besting the market return of around 24% (not including dividends). On the other hand, the returns haven't been quite so good recently, with shareholders up just 100% , including dividends .
On the back of a solid 7-day performance, let's check what role the company's fundamentals have played in driving long term shareholder returns.
View our latest analysis for Duna House Holding Nyrt
In his essay The Superinvestors of Graham-and-Doddsville Warren Buffett described how share prices do not always rationally reflect the value of a business. One imperfect but simple way to consider how the market perception of a company has shifted is to compare the change in the earnings per share (EPS) with the share price movement.
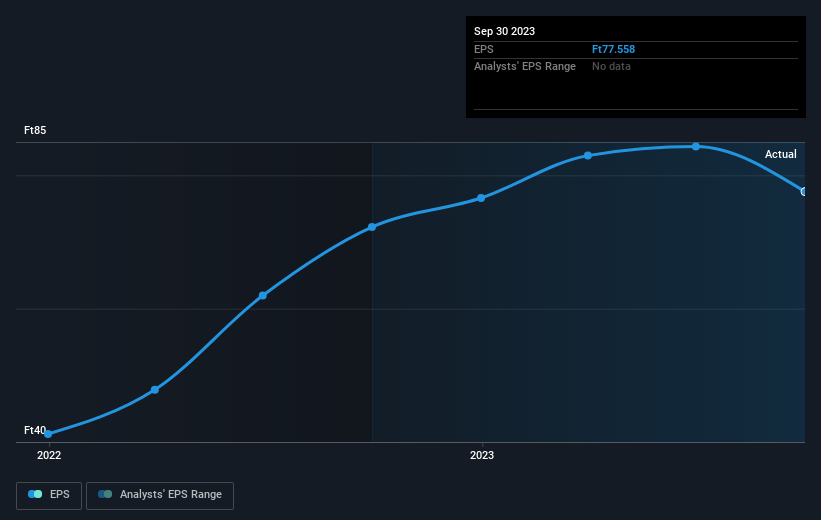
Duna House Holding Nyrt was able to grow its EPS at 23% per year over three years, sending the share price higher. This EPS growth is remarkably close to the 24% average annual increase in the share price. This observation indicates that the market's attitude to the business hasn't changed all that much. Rather, the share price has approximately tracked EPS growth.
The graphic below depicts how EPS has changed over time (unveil the exact values by clicking on the image).
Before buying or selling a stock, we always recommend a close examination of historic growth trends, available here.
What About Dividends?
It is important to consider the total shareholder return, as well as the share price return, for any given stock. Whereas the share price return only reflects the change in the share price, the TSR includes the value of dividends (assuming they were reinvested) and the benefit of any discounted capital raising or spin-off. Arguably, the TSR gives a more comprehensive picture of the return generated by a stock. In the case of Duna House Holding Nyrt, it has a TSR of 162% for the last 3 years. That exceeds its share price return that we previously mentioned. And there's no prize for guessing that the dividend payments largely explain the divergence!
A Different Perspective
It's nice to see that Duna House Holding Nyrt shareholders have received a total shareholder return of 100% over the last year. And that does include the dividend. That gain is better than the annual TSR over five years, which is 21%. Therefore it seems like sentiment around the company has been positive lately. Someone with an optimistic perspective could view the recent improvement in TSR as indicating that the business itself is getting better with time. It's always interesting to track share price performance over the longer term. But to understand Duna House Holding Nyrt better, we need to consider many other factors. Even so, be aware that Duna House Holding Nyrt is showing 3 warning signs in our investment analysis , you should know about...
Of course, you might find a fantastic investment by looking elsewhere. So take a peek at this free list of companies we expect will grow earnings.
Please note, the market returns quoted in this article reflect the market weighted average returns of stocks that currently trade on Hungarian exchanges.
Valuation is complex, but we're helping make it simple.
Find out whether Duna House Holding Nyrt is potentially over or undervalued by checking out our comprehensive analysis, which includes fair value estimates, risks and warnings, dividends, insider transactions and financial health.
View the Free AnalysisHave feedback on this article? Concerned about the content? Get in touch with us directly. Alternatively, email editorial-team (at) simplywallst.com.
This article by Simply Wall St is general in nature. We provide commentary based on historical data and analyst forecasts only using an unbiased methodology and our articles are not intended to be financial advice. It does not constitute a recommendation to buy or sell any stock, and does not take account of your objectives, or your financial situation. We aim to bring you long-term focused analysis driven by fundamental data. Note that our analysis may not factor in the latest price-sensitive company announcements or qualitative material. Simply Wall St has no position in any stocks mentioned.
About BUSE:DUNAHOUSE
Duna House Holding Nyrt
Duna House Holding Nyrt. provides real estate agency services to the real estate and financial services sectors in Hungary, Poland, the Czech Republic, and Italy.
Mediocre balance sheet with questionable track record.
