Stock Analysis
- Hong Kong
- /
- Marine and Shipping
- /
- SEHK:1748
Xin Yuan Enterprises Group Full Year 2023 Earnings: EPS: US$0.019 (vs US$0.025 in FY 2022)


Xin Yuan Enterprises Group (HKG:1748) Full Year 2023 Results
Key Financial Results
- Revenue: US$58.9m (down 8.1% from FY 2022).
- Net income: US$8.50m (down 22% from FY 2022).
- Profit margin: 14% (down from 17% in FY 2022). The decrease in margin was driven by lower revenue.
- EPS: US$0.019 (down from US$0.025 in FY 2022).
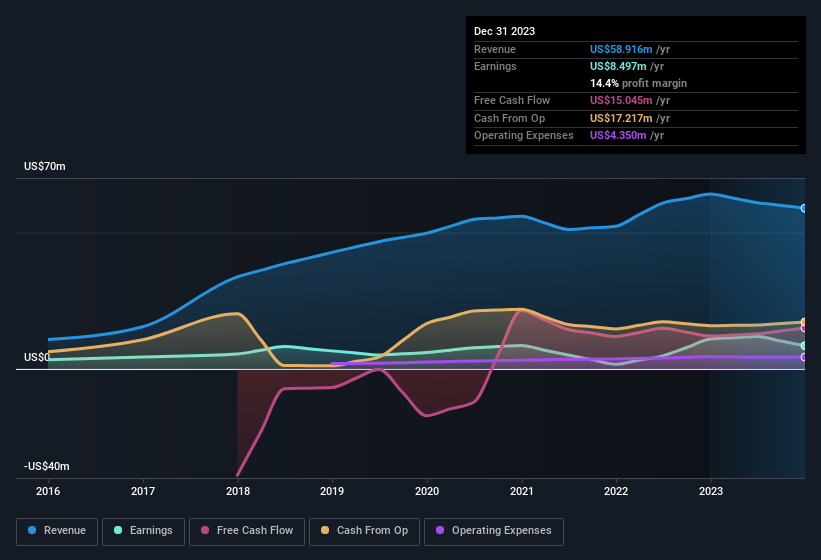
All figures shown in the chart above are for the trailing 12 month (TTM) period
Xin Yuan Enterprises Group's share price is broadly unchanged from a week ago.
Balance Sheet Analysis
While earnings are important, another area to consider is the balance sheet. See our latest analysis on Xin Yuan Enterprises Group's balance sheet health.
Valuation is complex, but we're helping make it simple.
Find out whether Xin Yuan Enterprises Group is potentially over or undervalued by checking out our comprehensive analysis, which includes fair value estimates, risks and warnings, dividends, insider transactions and financial health.
View the Free AnalysisHave feedback on this article? Concerned about the content? Get in touch with us directly. Alternatively, email editorial-team (at) simplywallst.com.
This article by Simply Wall St is general in nature. We provide commentary based on historical data and analyst forecasts only using an unbiased methodology and our articles are not intended to be financial advice. It does not constitute a recommendation to buy or sell any stock, and does not take account of your objectives, or your financial situation. We aim to bring you long-term focused analysis driven by fundamental data. Note that our analysis may not factor in the latest price-sensitive company announcements or qualitative material. Simply Wall St has no position in any stocks mentioned.
About SEHK:1748
Xin Yuan Enterprises Group
Xin Yuan Enterprises Group Limited, an investment holding company, provides asphalt tanker and bulk carrier chartering services in the People’s Republic of China, Hong Kong, and Singapore.
Mediocre balance sheet and slightly overvalued.
