Stock Analysis
Do Its Financials Have Any Role To Play In Driving eBroker Group Limited's (HKG:8036) Stock Up Recently?


eBroker Group (HKG:8036) has had a great run on the share market with its stock up by a significant 12% over the last week. We wonder if and what role the company's financials play in that price change as a company's long-term fundamentals usually dictate market outcomes. Specifically, we decided to study eBroker Group's ROE in this article.
Return on equity or ROE is a key measure used to assess how efficiently a company's management is utilizing the company's capital. In short, ROE shows the profit each dollar generates with respect to its shareholder investments.
Check out our latest analysis for eBroker Group
How To Calculate Return On Equity?
ROE can be calculated by using the formula:
Return on Equity = Net Profit (from continuing operations) ÷ Shareholders' Equity
So, based on the above formula, the ROE for eBroker Group is:
3.1% = HK$1.9m ÷ HK$63m (Based on the trailing twelve months to December 2023).
The 'return' is the amount earned after tax over the last twelve months. So, this means that for every HK$1 of its shareholder's investments, the company generates a profit of HK$0.03.
Why Is ROE Important For Earnings Growth?
Thus far, we have learned that ROE measures how efficiently a company is generating its profits. We now need to evaluate how much profit the company reinvests or "retains" for future growth which then gives us an idea about the growth potential of the company. Assuming everything else remains unchanged, the higher the ROE and profit retention, the higher the growth rate of a company compared to companies that don't necessarily bear these characteristics.
A Side By Side comparison of eBroker Group's Earnings Growth And 3.1% ROE
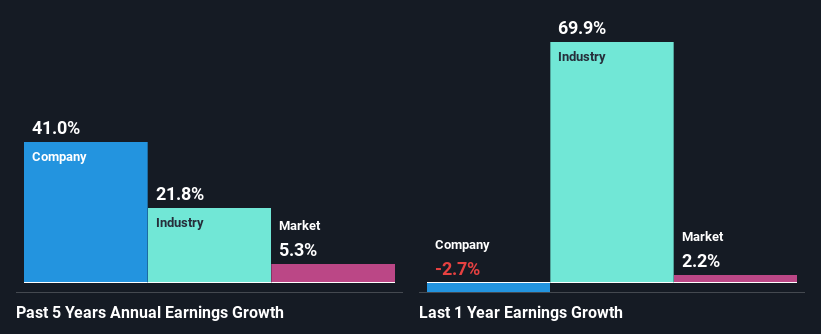
It is hard to argue that eBroker Group's ROE is much good in and of itself. Not just that, even compared to the industry average of 5.9%, the company's ROE is entirely unremarkable. Despite this, surprisingly, eBroker Group saw an exceptional 41% net income growth over the past five years. Therefore, there could be other reasons behind this growth. For example, it is possible that the company's management has made some good strategic decisions, or that the company has a low payout ratio.
We then compared eBroker Group's net income growth with the industry and we're pleased to see that the company's growth figure is higher when compared with the industry which has a growth rate of 22% in the same 5-year period.
The basis for attaching value to a company is, to a great extent, tied to its earnings growth. The investor should try to establish if the expected growth or decline in earnings, whichever the case may be, is priced in. Doing so will help them establish if the stock's future looks promising or ominous. If you're wondering about eBroker Group's's valuation, check out this gauge of its price-to-earnings ratio, as compared to its industry.
Is eBroker Group Using Its Retained Earnings Effectively?
eBroker Group doesn't pay any regular dividends to its shareholders, meaning that the company has been reinvesting all of its profits into the business. This is likely what's driving the high earnings growth number discussed above.
Conclusion
In total, it does look like eBroker Group has some positive aspects to its business. Despite its low rate of return, the fact that the company reinvests a very high portion of its profits into its business, no doubt contributed to its high earnings growth. While we won't completely dismiss the company, what we would do, is try to ascertain how risky the business is to make a more informed decision around the company. Our risks dashboard would have the 3 risks we have identified for eBroker Group.
Valuation is complex, but we're helping make it simple.
Find out whether eBroker Group is potentially over or undervalued by checking out our comprehensive analysis, which includes fair value estimates, risks and warnings, dividends, insider transactions and financial health.
View the Free AnalysisHave feedback on this article? Concerned about the content? Get in touch with us directly. Alternatively, email editorial-team (at) simplywallst.com.
This article by Simply Wall St is general in nature. We provide commentary based on historical data and analyst forecasts only using an unbiased methodology and our articles are not intended to be financial advice. It does not constitute a recommendation to buy or sell any stock, and does not take account of your objectives, or your financial situation. We aim to bring you long-term focused analysis driven by fundamental data. Note that our analysis may not factor in the latest price-sensitive company announcements or qualitative material. Simply Wall St has no position in any stocks mentioned.
About SEHK:8036
eBroker Group
An investment holding company, provides financial software solution services in Hong Kong, Macau, Singapore, and Mainland China.
Flawless balance sheet with poor track record.

