Is SANVO Fine Chemicals Group Limited's (HKG:301) Stock Price Struggling As A Result Of Its Mixed Financials?


With its stock down 25% over the past three months, it is easy to disregard SANVO Fine Chemicals Group (HKG:301). We, however decided to study the company's financials to determine if they have got anything to do with the price decline. Stock prices are usually driven by a company’s financial performance over the long term, and therefore we decided to pay more attention to the company's financial performance. Specifically, we decided to study SANVO Fine Chemicals Group's ROE in this article.
Return on equity or ROE is an important factor to be considered by a shareholder because it tells them how effectively their capital is being reinvested. Put another way, it reveals the company's success at turning shareholder investments into profits.
See our latest analysis for SANVO Fine Chemicals Group
How Is ROE Calculated?
The formula for ROE is:
Return on Equity = Net Profit (from continuing operations) ÷ Shareholders' Equity
So, based on the above formula, the ROE for SANVO Fine Chemicals Group is:
2.7% = CN¥6.3m ÷ CN¥232m (Based on the trailing twelve months to December 2023).
The 'return' is the profit over the last twelve months. So, this means that for every HK$1 of its shareholder's investments, the company generates a profit of HK$0.03.
Why Is ROE Important For Earnings Growth?
So far, we've learned that ROE is a measure of a company's profitability. Depending on how much of these profits the company reinvests or "retains", and how effectively it does so, we are then able to assess a company’s earnings growth potential. Generally speaking, other things being equal, firms with a high return on equity and profit retention, have a higher growth rate than firms that don’t share these attributes.
SANVO Fine Chemicals Group's Earnings Growth And 2.7% ROE
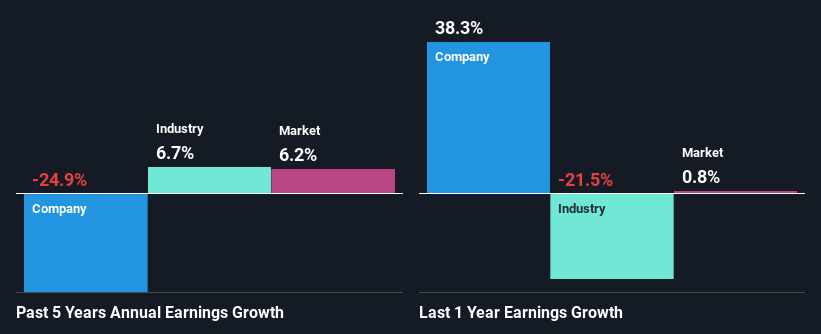
It is quite clear that SANVO Fine Chemicals Group's ROE is rather low. Even compared to the average industry ROE of 6.2%, the company's ROE is quite dismal. Given the circumstances, the significant decline in net income by 25% seen by SANVO Fine Chemicals Group over the last five years is not surprising. We believe that there also might be other aspects that are negatively influencing the company's earnings prospects. Such as - low earnings retention or poor allocation of capital.
However, when we compared SANVO Fine Chemicals Group's growth with the industry we found that while the company's earnings have been shrinking, the industry has seen an earnings growth of 6.7% in the same period. This is quite worrisome.
Earnings growth is an important metric to consider when valuing a stock. The investor should try to establish if the expected growth or decline in earnings, whichever the case may be, is priced in. By doing so, they will have an idea if the stock is headed into clear blue waters or if swampy waters await. If you're wondering about SANVO Fine Chemicals Group's's valuation, check out this gauge of its price-to-earnings ratio, as compared to its industry.
Is SANVO Fine Chemicals Group Using Its Retained Earnings Effectively?
While the company did payout a portion of its dividend in the past, it currently doesn't pay a regular dividend. This implies that potentially all of its profits are being reinvested in the business.
Conclusion
In total, we're a bit ambivalent about SANVO Fine Chemicals Group's performance. While the company does have a high rate of profit retention, its low rate of return is probably hampering its earnings growth. Until now, we have only just grazed the surface of the company's past performance by looking at the company's fundamentals. To gain further insights into SANVO Fine Chemicals Group's past profit growth, check out this visualization of past earnings, revenue and cash flows.
New: Manage All Your Stock Portfolios in One Place
We've created the ultimate portfolio companion for stock investors, and it's free.
• Connect an unlimited number of Portfolios and see your total in one currency
• Be alerted to new Warning Signs or Risks via email or mobile
• Track the Fair Value of your stocks
Have feedback on this article? Concerned about the content? Get in touch with us directly. Alternatively, email editorial-team (at) simplywallst.com.
This article by Simply Wall St is general in nature. We provide commentary based on historical data and analyst forecasts only using an unbiased methodology and our articles are not intended to be financial advice. It does not constitute a recommendation to buy or sell any stock, and does not take account of your objectives, or your financial situation. We aim to bring you long-term focused analysis driven by fundamental data. Note that our analysis may not factor in the latest price-sensitive company announcements or qualitative material. Simply Wall St has no position in any stocks mentioned.
About SEHK:301
SANVO Fine Chemicals Group
An investment holding company, researches, develops, manufactures, and sells fine industrial chemical products in the People's Republic of China, Australia, and internationally.
Proven track record slight.
