Stock Analysis
- Hong Kong
- /
- Capital Markets
- /
- SEHK:1697
Shandong International Trust (HKG:1697) stock falls 11% in past week as five-year earnings and shareholder returns continue downward trend


Long term investing is the way to go, but that doesn't mean you should hold every stock forever. We really hate to see fellow investors lose their hard-earned money. For example, we sympathize with anyone who was caught holding Shandong International Trust Co., Ltd. (HKG:1697) during the five years that saw its share price drop a whopping 76%. And we doubt long term believers are the only worried holders, since the stock price has declined 25% over the last twelve months. The last week also saw the share price slip down another 11%.
Since Shandong International Trust has shed HK$163m from its value in the past 7 days, let's see if the longer term decline has been driven by the business' economics.
See our latest analysis for Shandong International Trust
While the efficient markets hypothesis continues to be taught by some, it has been proven that markets are over-reactive dynamic systems, and investors are not always rational. By comparing earnings per share (EPS) and share price changes over time, we can get a feel for how investor attitudes to a company have morphed over time.
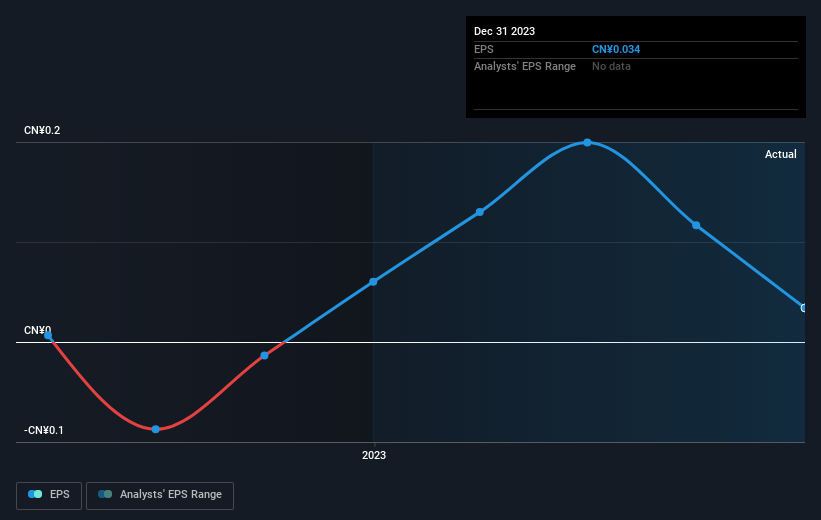
During the five years over which the share price declined, Shandong International Trust's earnings per share (EPS) dropped by 29% each year. Notably, the share price has fallen at 25% per year, fairly close to the change in the EPS. This implies that the market has had a fairly steady view of the stock. So it's fair to say the share price has been responding to changes in EPS.
The graphic below depicts how EPS has changed over time (unveil the exact values by clicking on the image).
It's probably worth noting that the CEO is paid less than the median at similar sized companies. It's always worth keeping an eye on CEO pay, but a more important question is whether the company will grow earnings throughout the years. Dive deeper into the earnings by checking this interactive graph of Shandong International Trust's earnings, revenue and cash flow.
What About The Total Shareholder Return (TSR)?
We'd be remiss not to mention the difference between Shandong International Trust's total shareholder return (TSR) and its share price return. Arguably the TSR is a more complete return calculation because it accounts for the value of dividends (as if they were reinvested), along with the hypothetical value of any discounted capital that have been offered to shareholders. Shandong International Trust's TSR of was a loss of 71% for the 5 years. That wasn't as bad as its share price return, because it has paid dividends.
A Different Perspective
We regret to report that Shandong International Trust shareholders are down 25% for the year. Unfortunately, that's worse than the broader market decline of 9.2%. Having said that, it's inevitable that some stocks will be oversold in a falling market. The key is to keep your eyes on the fundamental developments. Unfortunately, last year's performance may indicate unresolved challenges, given that it was worse than the annualised loss of 11% over the last half decade. We realise that Baron Rothschild has said investors should "buy when there is blood on the streets", but we caution that investors should first be sure they are buying a high quality business. I find it very interesting to look at share price over the long term as a proxy for business performance. But to truly gain insight, we need to consider other information, too. Take risks, for example - Shandong International Trust has 3 warning signs (and 2 which are a bit concerning) we think you should know about.
But note: Shandong International Trust may not be the best stock to buy. So take a peek at this free list of interesting companies with past earnings growth (and further growth forecast).
Please note, the market returns quoted in this article reflect the market weighted average returns of stocks that currently trade on Hong Kong exchanges.
Valuation is complex, but we're helping make it simple.
Find out whether Shandong International Trust is potentially over or undervalued by checking out our comprehensive analysis, which includes fair value estimates, risks and warnings, dividends, insider transactions and financial health.
View the Free AnalysisHave feedback on this article? Concerned about the content? Get in touch with us directly. Alternatively, email editorial-team (at) simplywallst.com.
This article by Simply Wall St is general in nature. We provide commentary based on historical data and analyst forecasts only using an unbiased methodology and our articles are not intended to be financial advice. It does not constitute a recommendation to buy or sell any stock, and does not take account of your objectives, or your financial situation. We aim to bring you long-term focused analysis driven by fundamental data. Note that our analysis may not factor in the latest price-sensitive company announcements or qualitative material. Simply Wall St has no position in any stocks mentioned.
About SEHK:1697
Shandong International Trust
Shandong International Trust Co., Ltd., a non-bank financial institution, provides various trust services in the People’s Republic of China.
Good value with mediocre balance sheet.
