Stock Analysis
- Hong Kong
- /
- Consumer Services
- /
- SEHK:1773
Tianli International Holdings' (HKG:1773) 247% YoY earnings expansion surpassed the shareholder returns over the past year


Unless you borrow money to invest, the potential losses are limited. But if you pick the right stock, you can make a lot more than 100%. For example, the Tianli International Holdings Limited (HKG:1773) share price had more than doubled in just one year - up 111%. Also pleasing for shareholders was the 49% gain in the last three months. In contrast, the longer term returns are negative, since the share price is 41% lower than it was three years ago.
On the back of a solid 7-day performance, let's check what role the company's fundamentals have played in driving long term shareholder returns.
Check out our latest analysis for Tianli International Holdings
To paraphrase Benjamin Graham: Over the short term the market is a voting machine, but over the long term it's a weighing machine. One flawed but reasonable way to assess how sentiment around a company has changed is to compare the earnings per share (EPS) with the share price.
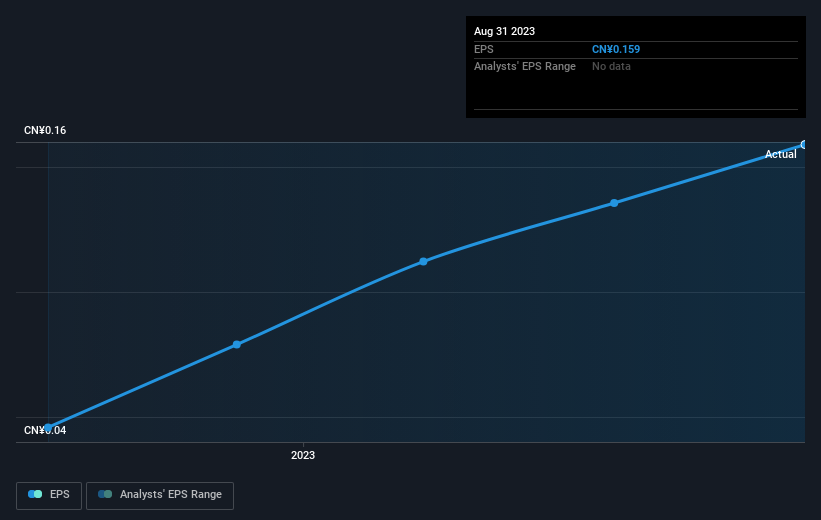
Tianli International Holdings was able to grow EPS by 247% in the last twelve months. This EPS growth is significantly higher than the 111% increase in the share price. Therefore, it seems the market isn't as excited about Tianli International Holdings as it was before. This could be an opportunity.
You can see below how EPS has changed over time (discover the exact values by clicking on the image).
We consider it positive that insiders have made significant purchases in the last year. Even so, future earnings will be far more important to whether current shareholders make money. It might be well worthwhile taking a look at our free report on Tianli International Holdings' earnings, revenue and cash flow.
What About Dividends?
When looking at investment returns, it is important to consider the difference between total shareholder return (TSR) and share price return. Whereas the share price return only reflects the change in the share price, the TSR includes the value of dividends (assuming they were reinvested) and the benefit of any discounted capital raising or spin-off. It's fair to say that the TSR gives a more complete picture for stocks that pay a dividend. In the case of Tianli International Holdings, it has a TSR of 116% for the last 1 year. That exceeds its share price return that we previously mentioned. And there's no prize for guessing that the dividend payments largely explain the divergence!
A Different Perspective
It's good to see that Tianli International Holdings has rewarded shareholders with a total shareholder return of 116% in the last twelve months. That's including the dividend. That's better than the annualised return of 11% over half a decade, implying that the company is doing better recently. Given the share price momentum remains strong, it might be worth taking a closer look at the stock, lest you miss an opportunity. I find it very interesting to look at share price over the long term as a proxy for business performance. But to truly gain insight, we need to consider other information, too. Consider risks, for instance. Every company has them, and we've spotted 1 warning sign for Tianli International Holdings you should know about.
Tianli International Holdings is not the only stock that insiders are buying. For those who like to find winning investments this free list of growing companies with recent insider purchasing, could be just the ticket.
Please note, the market returns quoted in this article reflect the market weighted average returns of stocks that currently trade on Hong Kong exchanges.
Valuation is complex, but we're helping make it simple.
Find out whether Tianli International Holdings is potentially over or undervalued by checking out our comprehensive analysis, which includes fair value estimates, risks and warnings, dividends, insider transactions and financial health.
View the Free AnalysisHave feedback on this article? Concerned about the content? Get in touch with us directly. Alternatively, email editorial-team (at) simplywallst.com.
This article by Simply Wall St is general in nature. We provide commentary based on historical data and analyst forecasts only using an unbiased methodology and our articles are not intended to be financial advice. It does not constitute a recommendation to buy or sell any stock, and does not take account of your objectives, or your financial situation. We aim to bring you long-term focused analysis driven by fundamental data. Note that our analysis may not factor in the latest price-sensitive company announcements or qualitative material. Simply Wall St has no position in any stocks mentioned.
About SEHK:1773
Tianli International Holdings
Tianli International Holdings Limited, an investment holding company, provides education management and diversified services in China.
Proven track record with limited growth.
