Stock Analysis
The three-year loss for Shenzhou International Group Holdings (HKG:2313) shareholders likely driven by its shrinking earnings


Shenzhou International Group Holdings Limited (HKG:2313) shareholders will doubtless be very grateful to see the share price up 34% in the last quarter. But that doesn't change the fact that the returns over the last three years have been less than pleasing. In fact, the share price is down 51% in the last three years, falling well short of the market return.
On a more encouraging note the company has added HK$4.8b to its market cap in just the last 7 days, so let's see if we can determine what's driven the three-year loss for shareholders.
See our latest analysis for Shenzhou International Group Holdings
While the efficient markets hypothesis continues to be taught by some, it has been proven that markets are over-reactive dynamic systems, and investors are not always rational. One imperfect but simple way to consider how the market perception of a company has shifted is to compare the change in the earnings per share (EPS) with the share price movement.
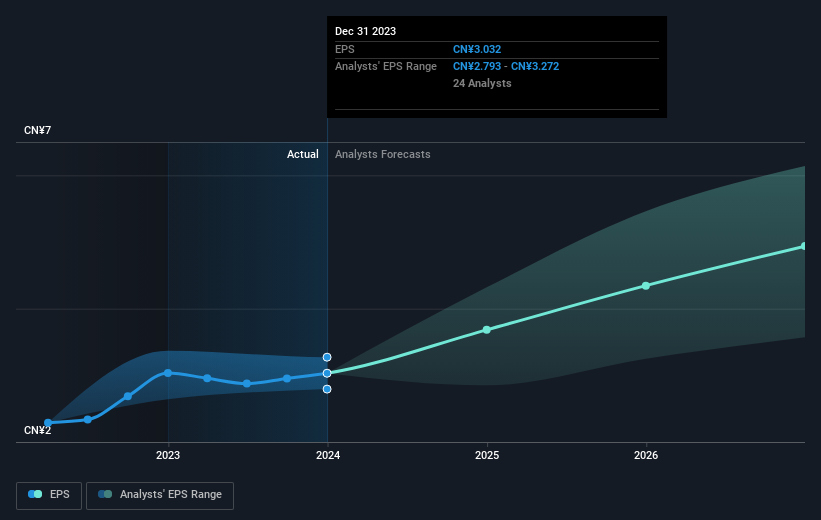
During the three years that the share price fell, Shenzhou International Group Holdings' earnings per share (EPS) dropped by 3.7% each year. This reduction in EPS is slower than the 21% annual reduction in the share price. So it seems the market was too confident about the business, in the past.
The image below shows how EPS has tracked over time (if you click on the image you can see greater detail).
Dive deeper into Shenzhou International Group Holdings' key metrics by checking this interactive graph of Shenzhou International Group Holdings's earnings, revenue and cash flow.
What About Dividends?
When looking at investment returns, it is important to consider the difference between total shareholder return (TSR) and share price return. The TSR incorporates the value of any spin-offs or discounted capital raisings, along with any dividends, based on the assumption that the dividends are reinvested. It's fair to say that the TSR gives a more complete picture for stocks that pay a dividend. We note that for Shenzhou International Group Holdings the TSR over the last 3 years was -48%, which is better than the share price return mentioned above. And there's no prize for guessing that the dividend payments largely explain the divergence!
A Different Perspective
It's nice to see that Shenzhou International Group Holdings shareholders have received a total shareholder return of 31% over the last year. That's including the dividend. Notably the five-year annualised TSR loss of 1.3% per year compares very unfavourably with the recent share price performance. We generally put more weight on the long term performance over the short term, but the recent improvement could hint at a (positive) inflection point within the business. Is Shenzhou International Group Holdings cheap compared to other companies? These 3 valuation measures might help you decide.
If you like to buy stocks alongside management, then you might just love this free list of companies. (Hint: insiders have been buying them).
Please note, the market returns quoted in this article reflect the market weighted average returns of stocks that currently trade on Hong Kong exchanges.
Valuation is complex, but we're helping make it simple.
Find out whether Shenzhou International Group Holdings is potentially over or undervalued by checking out our comprehensive analysis, which includes fair value estimates, risks and warnings, dividends, insider transactions and financial health.
View the Free AnalysisHave feedback on this article? Concerned about the content? Get in touch with us directly. Alternatively, email editorial-team (at) simplywallst.com.
This article by Simply Wall St is general in nature. We provide commentary based on historical data and analyst forecasts only using an unbiased methodology and our articles are not intended to be financial advice. It does not constitute a recommendation to buy or sell any stock, and does not take account of your objectives, or your financial situation. We aim to bring you long-term focused analysis driven by fundamental data. Note that our analysis may not factor in the latest price-sensitive company announcements or qualitative material. Simply Wall St has no position in any stocks mentioned.
About SEHK:2313
Shenzhou International Group Holdings
An investment holding company, engages in the manufacture, printing, and sale of knitwear products in Mainland China, European Union, the United States, Japan, and internationally.
Excellent balance sheet with moderate growth potential.

