Stock Analysis
- Hong Kong
- /
- Construction
- /
- SEHK:6038
Is G & M Holdings Limited's (HKG:6038) Recent Stock Performance Tethered To Its Strong Fundamentals?


G & M Holdings (HKG:6038) has had a great run on the share market with its stock up by a significant 55% over the last three months. Given that the market rewards strong financials in the long-term, we wonder if that is the case in this instance. Particularly, we will be paying attention to G & M Holdings' ROE today.
ROE or return on equity is a useful tool to assess how effectively a company can generate returns on the investment it received from its shareholders. Put another way, it reveals the company's success at turning shareholder investments into profits.
View our latest analysis for G & M Holdings
How To Calculate Return On Equity?
The formula for return on equity is:
Return on Equity = Net Profit (from continuing operations) ÷ Shareholders' Equity
So, based on the above formula, the ROE for G & M Holdings is:
18% = HK$57m ÷ HK$314m (Based on the trailing twelve months to December 2023).
The 'return' is the yearly profit. That means that for every HK$1 worth of shareholders' equity, the company generated HK$0.18 in profit.
What Has ROE Got To Do With Earnings Growth?
We have already established that ROE serves as an efficient profit-generating gauge for a company's future earnings. We now need to evaluate how much profit the company reinvests or "retains" for future growth which then gives us an idea about the growth potential of the company. Assuming everything else remains unchanged, the higher the ROE and profit retention, the higher the growth rate of a company compared to companies that don't necessarily bear these characteristics.
A Side By Side comparison of G & M Holdings' Earnings Growth And 18% ROE
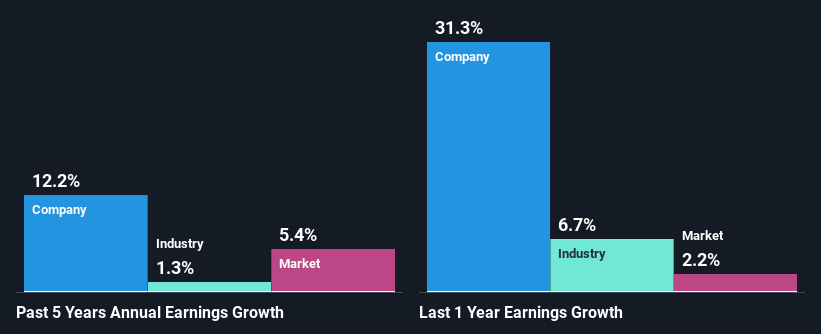
At first glance, G & M Holdings seems to have a decent ROE. Especially when compared to the industry average of 6.6% the company's ROE looks pretty impressive. This certainly adds some context to G & M Holdings' decent 12% net income growth seen over the past five years.
As a next step, we compared G & M Holdings' net income growth with the industry, and pleasingly, we found that the growth seen by the company is higher than the average industry growth of 1.3%.
Earnings growth is a huge factor in stock valuation. It’s important for an investor to know whether the market has priced in the company's expected earnings growth (or decline). By doing so, they will have an idea if the stock is headed into clear blue waters or if swampy waters await. Is G & M Holdings fairly valued compared to other companies? These 3 valuation measures might help you decide.
Is G & M Holdings Using Its Retained Earnings Effectively?
While G & M Holdings has a three-year median payout ratio of 51% (which means it retains 49% of profits), the company has still seen a fair bit of earnings growth in the past, meaning that its high payout ratio hasn't hampered its ability to grow.
Besides, G & M Holdings has been paying dividends over a period of six years. This shows that the company is committed to sharing profits with its shareholders.
Summary
Overall, we are quite pleased with G & M Holdings' performance. We are particularly impressed by the considerable earnings growth posted by the company, which was likely backed by its high ROE. While the company is paying out most of its earnings as dividends, it has been able to grow its earnings in spite of it, so that's probably a good sign. Until now, we have only just grazed the surface of the company's past performance by looking at the company's fundamentals. So it may be worth checking this free detailed graph of G & M Holdings' past earnings, as well as revenue and cash flows to get a deeper insight into the company's performance.
Valuation is complex, but we're helping make it simple.
Find out whether G & M Holdings is potentially over or undervalued by checking out our comprehensive analysis, which includes fair value estimates, risks and warnings, dividends, insider transactions and financial health.
View the Free AnalysisHave feedback on this article? Concerned about the content? Get in touch with us directly. Alternatively, email editorial-team (at) simplywallst.com.
This article by Simply Wall St is general in nature. We provide commentary based on historical data and analyst forecasts only using an unbiased methodology and our articles are not intended to be financial advice. It does not constitute a recommendation to buy or sell any stock, and does not take account of your objectives, or your financial situation. We aim to bring you long-term focused analysis driven by fundamental data. Note that our analysis may not factor in the latest price-sensitive company announcements or qualitative material. Simply Wall St has no position in any stocks mentioned.
About SEHK:6038
G & M Holdings
An investment holding company, provides design and build, and repair and maintenance services in relation to podium facade and curtain wall works in Hong Kong and the People’s Republic of China.
Flawless balance sheet with solid track record and pays a dividend.

