- United Kingdom
- /
- Professional Services
- /
- LSE:WIL
Wilmington (LON:WIL) jumps 11% this week, though earnings growth is still tracking behind three-year shareholder returns


The most you can lose on any stock (assuming you don't use leverage) is 100% of your money. But when you pick a company that is really flourishing, you can make more than 100%. For instance the Wilmington plc (LON:WIL) share price is 124% higher than it was three years ago. How nice for those who held the stock! It's even up 11% in the last week.
On the back of a solid 7-day performance, let's check what role the company's fundamentals have played in driving long term shareholder returns.
View our latest analysis for Wilmington
To quote Buffett, 'Ships will sail around the world but the Flat Earth Society will flourish. There will continue to be wide discrepancies between price and value in the marketplace...' One way to examine how market sentiment has changed over time is to look at the interaction between a company's share price and its earnings per share (EPS).
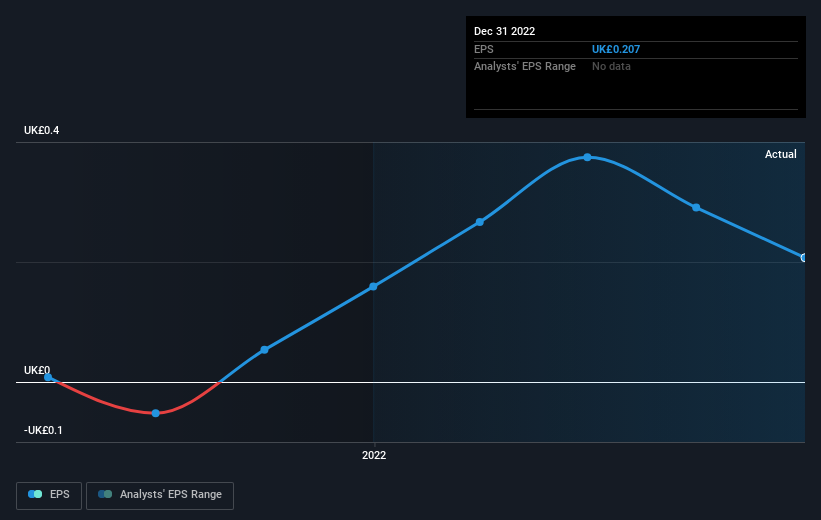
Wilmington was able to grow its EPS at 25% per year over three years, sending the share price higher. We don't think it is entirely coincidental that the EPS growth is reasonably close to the 31% average annual increase in the share price. This suggests that sentiment and expectations have not changed drastically. Au contraire, the share price change has arguably mimicked the EPS growth.
You can see how EPS has changed over time in the image below (click on the chart to see the exact values).
We know that Wilmington has improved its bottom line lately, but is it going to grow revenue? Check if analysts think Wilmington will grow revenue in the future.
What About Dividends?
As well as measuring the share price return, investors should also consider the total shareholder return (TSR). The TSR incorporates the value of any spin-offs or discounted capital raisings, along with any dividends, based on the assumption that the dividends are reinvested. Arguably, the TSR gives a more comprehensive picture of the return generated by a stock. In the case of Wilmington, it has a TSR of 140% for the last 3 years. That exceeds its share price return that we previously mentioned. And there's no prize for guessing that the dividend payments largely explain the divergence!
A Different Perspective
It's good to see that Wilmington has rewarded shareholders with a total shareholder return of 10% in the last twelve months. That's including the dividend. However, that falls short of the 12% TSR per annum it has made for shareholders, each year, over five years. It's always interesting to track share price performance over the longer term. But to understand Wilmington better, we need to consider many other factors. For example, we've discovered 1 warning sign for Wilmington that you should be aware of before investing here.
Of course, you might find a fantastic investment by looking elsewhere. So take a peek at this free list of companies we expect will grow earnings.
Please note, the market returns quoted in this article reflect the market weighted average returns of stocks that currently trade on British exchanges.
Valuation is complex, but we're here to simplify it.
Discover if Wilmington might be undervalued or overvalued with our detailed analysis, featuring fair value estimates, potential risks, dividends, insider trades, and its financial condition.
Access Free AnalysisHave feedback on this article? Concerned about the content? Get in touch with us directly. Alternatively, email editorial-team (at) simplywallst.com.
This article by Simply Wall St is general in nature. We provide commentary based on historical data and analyst forecasts only using an unbiased methodology and our articles are not intended to be financial advice. It does not constitute a recommendation to buy or sell any stock, and does not take account of your objectives, or your financial situation. We aim to bring you long-term focused analysis driven by fundamental data. Note that our analysis may not factor in the latest price-sensitive company announcements or qualitative material. Simply Wall St has no position in any stocks mentioned.
About LSE:WIL
Wilmington
Provides information, data, training, and education solutions to professional markets in the United Kingdom, the rest of Europe, North America, and internationally.
Flawless balance sheet, good value and pays a dividend.
