Stock Analysis
- France
- /
- Aerospace & Defense
- /
- ENXTPA:ALNSE
NSE S.A.'s (EPA:ALNSE) Stock Has Been Sliding But Fundamentals Look Strong: Is The Market Wrong?


NSE (EPA:ALNSE) has had a rough three months with its share price down 16%. However, a closer look at its sound financials might cause you to think again. Given that fundamentals usually drive long-term market outcomes, the company is worth looking at. In this article, we decided to focus on NSE's ROE.
Return on Equity or ROE is a test of how effectively a company is growing its value and managing investors’ money. In other words, it is a profitability ratio which measures the rate of return on the capital provided by the company's shareholders.
See our latest analysis for NSE
How Is ROE Calculated?
The formula for ROE is:
Return on Equity = Net Profit (from continuing operations) ÷ Shareholders' Equity
So, based on the above formula, the ROE for NSE is:
9.4% = €3.5m ÷ €37m (Based on the trailing twelve months to June 2023).
The 'return' is the profit over the last twelve months. That means that for every €1 worth of shareholders' equity, the company generated €0.09 in profit.
What Is The Relationship Between ROE And Earnings Growth?
Thus far, we have learned that ROE measures how efficiently a company is generating its profits. Depending on how much of these profits the company reinvests or "retains", and how effectively it does so, we are then able to assess a company’s earnings growth potential. Assuming all else is equal, companies that have both a higher return on equity and higher profit retention are usually the ones that have a higher growth rate when compared to companies that don't have the same features.
NSE's Earnings Growth And 9.4% ROE
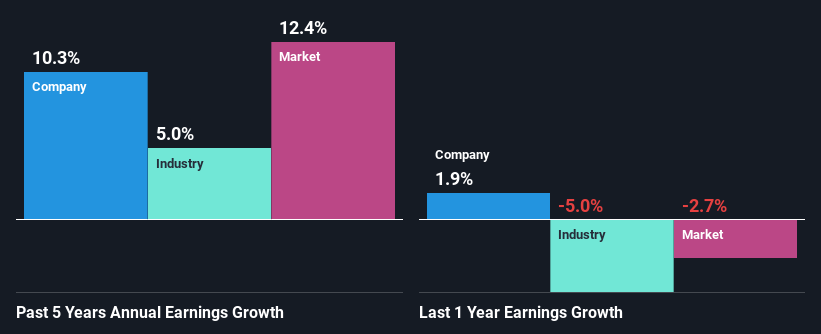
To begin with, NSE seems to have a respectable ROE. Even so, when compared with the average industry ROE of 13%, we aren't very excited. Although, we can see that NSE saw a modest net income growth of 10% over the past five years. We reckon that there could be other factors at play here. For instance, the company has a low payout ratio or is being managed efficiently. Bear in mind, the company does have a respectable level of ROE. It is just that the industry ROE is higher. So this also provides some context to the earnings growth seen by the company.
Next, on comparing with the industry net income growth, we found that NSE's growth is quite high when compared to the industry average growth of 5.0% in the same period, which is great to see.
Earnings growth is an important metric to consider when valuing a stock. It’s important for an investor to know whether the market has priced in the company's expected earnings growth (or decline). This then helps them determine if the stock is placed for a bright or bleak future. One good indicator of expected earnings growth is the P/E ratio which determines the price the market is willing to pay for a stock based on its earnings prospects. So, you may want to check if NSE is trading on a high P/E or a low P/E, relative to its industry.
Is NSE Using Its Retained Earnings Effectively?
NSE has a low three-year median payout ratio of 19%, meaning that the company retains the remaining 81% of its profits. This suggests that the management is reinvesting most of the profits to grow the business.
Additionally, NSE has paid dividends over a period of at least ten years which means that the company is pretty serious about sharing its profits with shareholders.
Conclusion
In total, we are pretty happy with NSE's performance. Particularly, we like that the company is reinvesting heavily into its business at a moderate rate of return. Unsurprisingly, this has led to an impressive earnings growth. If the company continues to grow its earnings the way it has, that could have a positive impact on its share price given how earnings per share influence long-term share prices. Remember, the price of a stock is also dependent on the perceived risk. Therefore investors must keep themselves informed about the risks involved before investing in any company. To know the 1 risk we have identified for NSE visit our risks dashboard for free.
Valuation is complex, but we're helping make it simple.
Find out whether NSE is potentially over or undervalued by checking out our comprehensive analysis, which includes fair value estimates, risks and warnings, dividends, insider transactions and financial health.
View the Free AnalysisHave feedback on this article? Concerned about the content? Get in touch with us directly. Alternatively, email editorial-team (at) simplywallst.com.
This article by Simply Wall St is general in nature. We provide commentary based on historical data and analyst forecasts only using an unbiased methodology and our articles are not intended to be financial advice. It does not constitute a recommendation to buy or sell any stock, and does not take account of your objectives, or your financial situation. We aim to bring you long-term focused analysis driven by fundamental data. Note that our analysis may not factor in the latest price-sensitive company announcements or qualitative material. Simply Wall St has no position in any stocks mentioned.
About ENXTPA:ALNSE
NSE
NSE S.A. designs, builds, and sells integrated systems for defense, aeronautics, transport and industry, and consumer, professional, and retail industries in France and internationally.
Flawless balance sheet with proven track record.
