Stock Analysis
- Spain
- /
- Telecom Services and Carriers
- /
- BME:CLNX
Cellnex Telecom (BME:CLNX) shareholders have earned a 11% CAGR over the last five years


When we invest, we're generally looking for stocks that outperform the market average. And in our experience, buying the right stocks can give your wealth a significant boost. For example, the Cellnex Telecom, S.A. (BME:CLNX) share price is up 37% in the last 5 years, clearly besting the market return of around 9.0% (ignoring dividends).
So let's assess the underlying fundamentals over the last 5 years and see if they've moved in lock-step with shareholder returns.
Check out our latest analysis for Cellnex Telecom
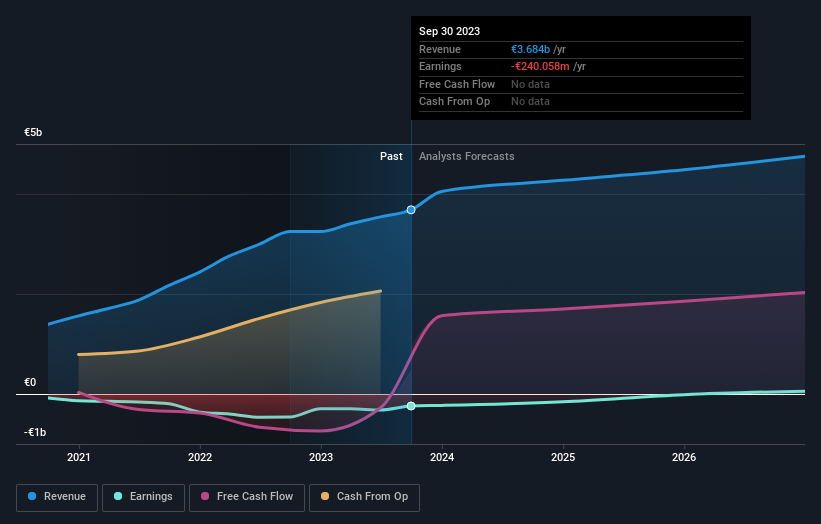
Because Cellnex Telecom made a loss in the last twelve months, we think the market is probably more focussed on revenue and revenue growth, at least for now. Generally speaking, companies without profits are expected to grow revenue every year, and at a good clip. That's because fast revenue growth can be easily extrapolated to forecast profits, often of considerable size.
For the last half decade, Cellnex Telecom can boast revenue growth at a rate of 32% per year. That's well above most pre-profit companies. While the compound gain of 7% per year is good, it's not unreasonable given the strong revenue growth. If the strong revenue growth continues, we'd expect the share price to follow, in time. Of course, you'll have to research the business more fully to figure out if this is an attractive opportunity.
You can see how earnings and revenue have changed over time in the image below (click on the chart to see the exact values).
Cellnex Telecom is well known by investors, and plenty of clever analysts have tried to predict the future profit levels. If you are thinking of buying or selling Cellnex Telecom stock, you should check out this free report showing analyst consensus estimates for future profits.
What About Dividends?
It is important to consider the total shareholder return, as well as the share price return, for any given stock. The TSR is a return calculation that accounts for the value of cash dividends (assuming that any dividend received was reinvested) and the calculated value of any discounted capital raisings and spin-offs. It's fair to say that the TSR gives a more complete picture for stocks that pay a dividend. We note that for Cellnex Telecom the TSR over the last 5 years was 71%, which is better than the share price return mentioned above. This is largely a result of its dividend payments!
A Different Perspective
While the broader market gained around 11% in the last year, Cellnex Telecom shareholders lost 5.0% (even including dividends). Even the share prices of good stocks drop sometimes, but we want to see improvements in the fundamental metrics of a business, before getting too interested. On the bright side, long term shareholders have made money, with a gain of 11% per year over half a decade. It could be that the recent sell-off is an opportunity, so it may be worth checking the fundamental data for signs of a long term growth trend. You could get a better understanding of Cellnex Telecom's growth by checking out this more detailed historical graph of earnings, revenue and cash flow.
If you are like me, then you will not want to miss this free list of growing companies that insiders are buying.
Please note, the market returns quoted in this article reflect the market weighted average returns of stocks that currently trade on Spanish exchanges.
Valuation is complex, but we're helping make it simple.
Find out whether Cellnex Telecom is potentially over or undervalued by checking out our comprehensive analysis, which includes fair value estimates, risks and warnings, dividends, insider transactions and financial health.
View the Free AnalysisHave feedback on this article? Concerned about the content? Get in touch with us directly. Alternatively, email editorial-team (at) simplywallst.com.
This article by Simply Wall St is general in nature. We provide commentary based on historical data and analyst forecasts only using an unbiased methodology and our articles are not intended to be financial advice. It does not constitute a recommendation to buy or sell any stock, and does not take account of your objectives, or your financial situation. We aim to bring you long-term focused analysis driven by fundamental data. Note that our analysis may not factor in the latest price-sensitive company announcements or qualitative material. Simply Wall St has no position in any stocks mentioned.
About BME:CLNX
Cellnex Telecom
Operates infrastructure for wireless telecommunication in Austria, Denmark, Spain, France, Ireland, Italy, the Netherlands, Poland, Portugal, the United Kingdom, Sweden, and Switzerland.
Reasonable growth potential with mediocre balance sheet.

