Stock Analysis
- Spain
- /
- Construction
- /
- BME:ENO
Elecnor (BME:ENO) shareholders notch a 28% CAGR over 3 years, yet earnings have been shrinking

By buying an index fund, investors can approximate the average market return. But if you pick the right individual stocks, you could make more than that. For example, the Elecnor, S.A. (BME:ENO) share price is up 92% in the last three years, clearly besting the market return of around 20% (not including dividends). On the other hand, the returns haven't been quite so good recently, with shareholders up just 73% , including dividends .
Since the stock has added €69m to its market cap in the past week alone, let's see if underlying performance has been driving long-term returns.
Check out our latest analysis for Elecnor
In his essay The Superinvestors of Graham-and-Doddsville Warren Buffett described how share prices do not always rationally reflect the value of a business. One imperfect but simple way to consider how the market perception of a company has shifted is to compare the change in the earnings per share (EPS) with the share price movement.
During the three years of share price growth, Elecnor actually saw its earnings per share (EPS) drop 7.1% per year.
This means it's unlikely the market is judging the company based on earnings growth. Since the change in EPS doesn't seem to correlate with the change in share price, it's worth taking a look at other metrics.
It may well be that Elecnor revenue growth rate of 16% over three years has convinced shareholders to believe in a brighter future. In that case, the company may be sacrificing current earnings per share to drive growth, and maybe shareholder's faith in better days ahead will be rewarded.
The company's revenue and earnings (over time) are depicted in the image below (click to see the exact numbers).
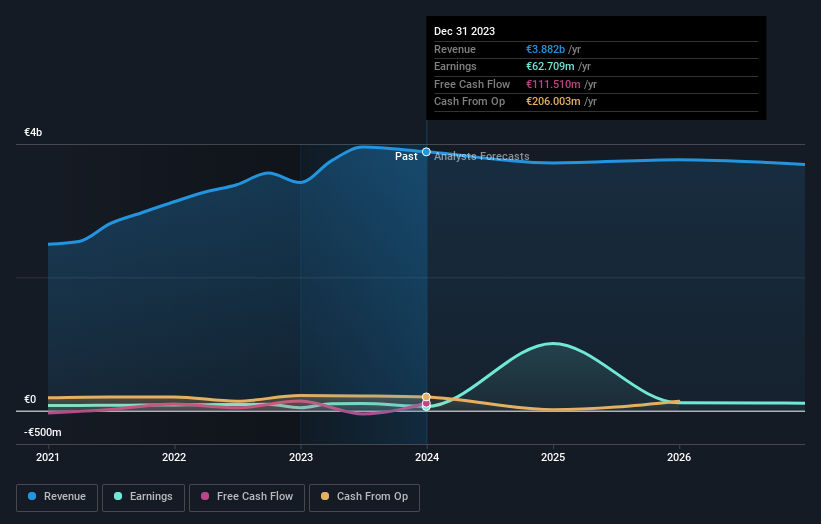
We know that Elecnor has improved its bottom line lately, but what does the future have in store? So we recommend checking out this free report showing consensus forecasts
What About Dividends?
It is important to consider the total shareholder return, as well as the share price return, for any given stock. The TSR incorporates the value of any spin-offs or discounted capital raisings, along with any dividends, based on the assumption that the dividends are reinvested. It's fair to say that the TSR gives a more complete picture for stocks that pay a dividend. In the case of Elecnor, it has a TSR of 107% for the last 3 years. That exceeds its share price return that we previously mentioned. This is largely a result of its dividend payments!
A Different Perspective
We're pleased to report that Elecnor shareholders have received a total shareholder return of 73% over one year. That's including the dividend. That gain is better than the annual TSR over five years, which is 14%. Therefore it seems like sentiment around the company has been positive lately. In the best case scenario, this may hint at some real business momentum, implying that now could be a great time to delve deeper. It's always interesting to track share price performance over the longer term. But to understand Elecnor better, we need to consider many other factors. Take risks, for example - Elecnor has 2 warning signs (and 1 which can't be ignored) we think you should know about.
For those who like to find winning investments this free list of growing companies with recent insider purchasing, could be just the ticket.
Please note, the market returns quoted in this article reflect the market weighted average returns of stocks that currently trade on Spanish exchanges.
Valuation is complex, but we're helping make it simple.
Find out whether Elecnor is potentially over or undervalued by checking out our comprehensive analysis, which includes fair value estimates, risks and warnings, dividends, insider transactions and financial health.
View the Free AnalysisHave feedback on this article? Concerned about the content? Get in touch with us directly. Alternatively, email editorial-team (at) simplywallst.com.
This article by Simply Wall St is general in nature. We provide commentary based on historical data and analyst forecasts only using an unbiased methodology and our articles are not intended to be financial advice. It does not constitute a recommendation to buy or sell any stock, and does not take account of your objectives, or your financial situation. We aim to bring you long-term focused analysis driven by fundamental data. Note that our analysis may not factor in the latest price-sensitive company announcements or qualitative material. Simply Wall St has no position in any stocks mentioned.
About BME:ENO
Elecnor
Elecnor, S.A. engages in the infrastructure and concessions businesses in Spain and internationally.
Flawless balance sheet, good value and pays a dividend.
