Stock Analysis
- Denmark
- /
- Life Sciences
- /
- CPSE:CHEMM
The total return for ChemoMetec (CPH:CHEMM) investors has risen faster than earnings growth over the last five years

It might be of some concern to shareholders to see the ChemoMetec A/S (CPH:CHEMM) share price down 26% in the last month. But in stark contrast, the returns over the last half decade have impressed. It's fair to say most would be happy with 141% the gain in that time. So while it's never fun to see a share price fall, it's important to look at a longer time horizon. Only time will tell if there is still too much optimism currently reflected in the share price. While the returns over the last 5 years have been good, we do feel sorry for those shareholders who haven't held shares that long, because the share price is down 37% in the last three years.
Since the long term performance has been good but there's been a recent pullback of 8.4%, let's check if the fundamentals match the share price.
See our latest analysis for ChemoMetec
There is no denying that markets are sometimes efficient, but prices do not always reflect underlying business performance. One imperfect but simple way to consider how the market perception of a company has shifted is to compare the change in the earnings per share (EPS) with the share price movement.
During five years of share price growth, ChemoMetec achieved compound earnings per share (EPS) growth of 31% per year. The EPS growth is more impressive than the yearly share price gain of 19% over the same period. Therefore, it seems the market has become relatively pessimistic about the company.
The graphic below depicts how EPS has changed over time (unveil the exact values by clicking on the image).
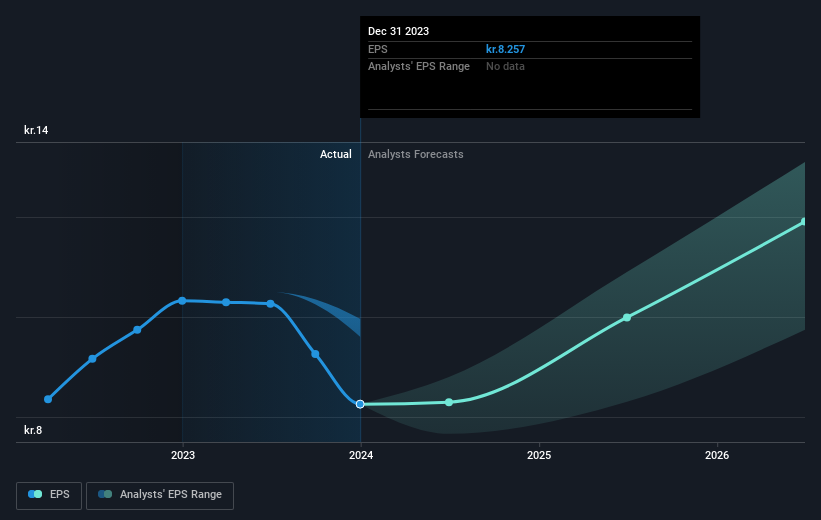
This free interactive report on ChemoMetec's earnings, revenue and cash flow is a great place to start, if you want to investigate the stock further.
What About Dividends?
As well as measuring the share price return, investors should also consider the total shareholder return (TSR). The TSR is a return calculation that accounts for the value of cash dividends (assuming that any dividend received was reinvested) and the calculated value of any discounted capital raisings and spin-offs. So for companies that pay a generous dividend, the TSR is often a lot higher than the share price return. In the case of ChemoMetec, it has a TSR of 177% for the last 5 years. That exceeds its share price return that we previously mentioned. And there's no prize for guessing that the dividend payments largely explain the divergence!
A Different Perspective
ChemoMetec shareholders are up 5.5% for the year (even including dividends). But that was short of the market average. On the bright side, the longer term returns (running at about 23% a year, over half a decade) look better. It may well be that this is a business worth popping on the watching, given the continuing positive reception, over time, from the market. While it is well worth considering the different impacts that market conditions can have on the share price, there are other factors that are even more important. Take risks, for example - ChemoMetec has 1 warning sign we think you should be aware of.
If you would prefer to check out another company -- one with potentially superior financials -- then do not miss this free list of companies that have proven they can grow earnings.
Please note, the market returns quoted in this article reflect the market weighted average returns of stocks that currently trade on Danish exchanges.
Valuation is complex, but we're helping make it simple.
Find out whether ChemoMetec is potentially over or undervalued by checking out our comprehensive analysis, which includes fair value estimates, risks and warnings, dividends, insider transactions and financial health.
View the Free AnalysisHave feedback on this article? Concerned about the content? Get in touch with us directly. Alternatively, email editorial-team (at) simplywallst.com.
This article by Simply Wall St is general in nature. We provide commentary based on historical data and analyst forecasts only using an unbiased methodology and our articles are not intended to be financial advice. It does not constitute a recommendation to buy or sell any stock, and does not take account of your objectives, or your financial situation. We aim to bring you long-term focused analysis driven by fundamental data. Note that our analysis may not factor in the latest price-sensitive company announcements or qualitative material. Simply Wall St has no position in any stocks mentioned.
About CPSE:CHEMM
ChemoMetec
ChemoMetec A/S engages in the development, production, and sale of analytical equipment for cell counting and analysis the United States, Canada, Europe, and internationally.
Flawless balance sheet with moderate growth potential.
