Stock Analysis
- China
- /
- Real Estate
- /
- SZSE:000036
The past five-year earnings decline for China Union Holdings (SZSE:000036) likely explains shareholders long-term losses


China Union Holdings Ltd. (SZSE:000036) shareholders should be happy to see the share price up 15% in the last month. But that doesn't change the fact that the returns over the last five years have been less than pleasing. After all, the share price is down 40% in that time, significantly under-performing the market.
While the last five years has been tough for China Union Holdings shareholders, this past week has shown signs of promise. So let's look at the longer term fundamentals and see if they've been the driver of the negative returns.
Check out our latest analysis for China Union Holdings
To quote Buffett, 'Ships will sail around the world but the Flat Earth Society will flourish. There will continue to be wide discrepancies between price and value in the marketplace...' By comparing earnings per share (EPS) and share price changes over time, we can get a feel for how investor attitudes to a company have morphed over time.
During the five years over which the share price declined, China Union Holdings' earnings per share (EPS) dropped by 39% each year. This fall in the EPS is worse than the 10% compound annual share price fall. So investors might expect EPS to bounce back -- or they may have previously foreseen the EPS decline. With a P/E ratio of 59.81, it's fair to say the market sees a brighter future for the business.
The image below shows how EPS has tracked over time (if you click on the image you can see greater detail).
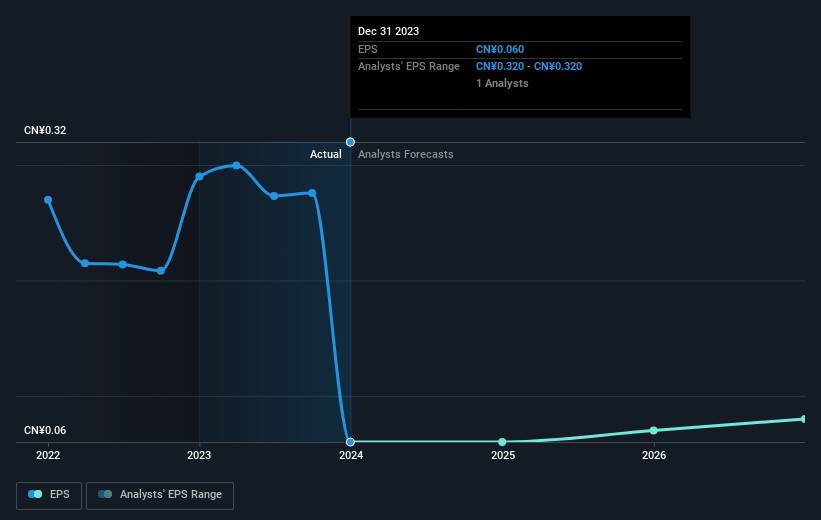
It might be well worthwhile taking a look at our free report on China Union Holdings' earnings, revenue and cash flow.
What About The Total Shareholder Return (TSR)?
Investors should note that there's a difference between China Union Holdings' total shareholder return (TSR) and its share price change, which we've covered above. Arguably the TSR is a more complete return calculation because it accounts for the value of dividends (as if they were reinvested), along with the hypothetical value of any discounted capital that have been offered to shareholders. Its history of dividend payouts mean that China Union Holdings' TSR, which was a 24% drop over the last 5 years, was not as bad as the share price return.
A Different Perspective
We regret to report that China Union Holdings shareholders are down 18% for the year. Unfortunately, that's worse than the broader market decline of 8.0%. Having said that, it's inevitable that some stocks will be oversold in a falling market. The key is to keep your eyes on the fundamental developments. Unfortunately, last year's performance may indicate unresolved challenges, given that it was worse than the annualised loss of 4% over the last half decade. Generally speaking long term share price weakness can be a bad sign, though contrarian investors might want to research the stock in hope of a turnaround. I find it very interesting to look at share price over the long term as a proxy for business performance. But to truly gain insight, we need to consider other information, too. Case in point: We've spotted 1 warning sign for China Union Holdings you should be aware of.
If you would prefer to check out another company -- one with potentially superior financials -- then do not miss this free list of companies that have proven they can grow earnings.
Please note, the market returns quoted in this article reflect the market weighted average returns of stocks that currently trade on Chinese exchanges.
Valuation is complex, but we're helping make it simple.
Find out whether China Union Holdings is potentially over or undervalued by checking out our comprehensive analysis, which includes fair value estimates, risks and warnings, dividends, insider transactions and financial health.
View the Free AnalysisHave feedback on this article? Concerned about the content? Get in touch with us directly. Alternatively, email editorial-team (at) simplywallst.com.
This article by Simply Wall St is general in nature. We provide commentary based on historical data and analyst forecasts only using an unbiased methodology and our articles are not intended to be financial advice. It does not constitute a recommendation to buy or sell any stock, and does not take account of your objectives, or your financial situation. We aim to bring you long-term focused analysis driven by fundamental data. Note that our analysis may not factor in the latest price-sensitive company announcements or qualitative material. Simply Wall St has no position in any stocks mentioned.
About SZSE:000036
China Union Holdings
Engages in the real estate development, property management, and service management in China.
Excellent balance sheet with concerning outlook.

