Stock Analysis
- China
- /
- Metals and Mining
- /
- SHSE:600282
Investing in Nanjing Iron & Steel (SHSE:600282) five years ago would have delivered you a 114% gain

Generally speaking the aim of active stock picking is to find companies that provide returns that are superior to the market average. And the truth is, you can make significant gains if you buy good quality businesses at the right price. For example, long term Nanjing Iron & Steel Co., Ltd. (SHSE:600282) shareholders have enjoyed a 49% share price rise over the last half decade, well in excess of the market return of around 15% (not including dividends).
Let's take a look at the underlying fundamentals over the longer term, and see if they've been consistent with shareholders returns.
See our latest analysis for Nanjing Iron & Steel
There is no denying that markets are sometimes efficient, but prices do not always reflect underlying business performance. By comparing earnings per share (EPS) and share price changes over time, we can get a feel for how investor attitudes to a company have morphed over time.
During five years of share price growth, Nanjing Iron & Steel actually saw its EPS drop 16% per year.
Essentially, it doesn't seem likely that investors are focused on EPS. Because earnings per share don't seem to match up with the share price, we'll take a look at other metrics instead.
We note that the dividend has not increased, so that doesn't seem to explain the increase, either. But it's reasonably likely that the 11% annual compound revenue growth is considered evidence that Nanjing Iron & Steel has plenty of growth ahead of it. Indeed, revenue growth, rather than EPS, might be the current focus of the business.
The graphic below depicts how earnings and revenue have changed over time (unveil the exact values by clicking on the image).
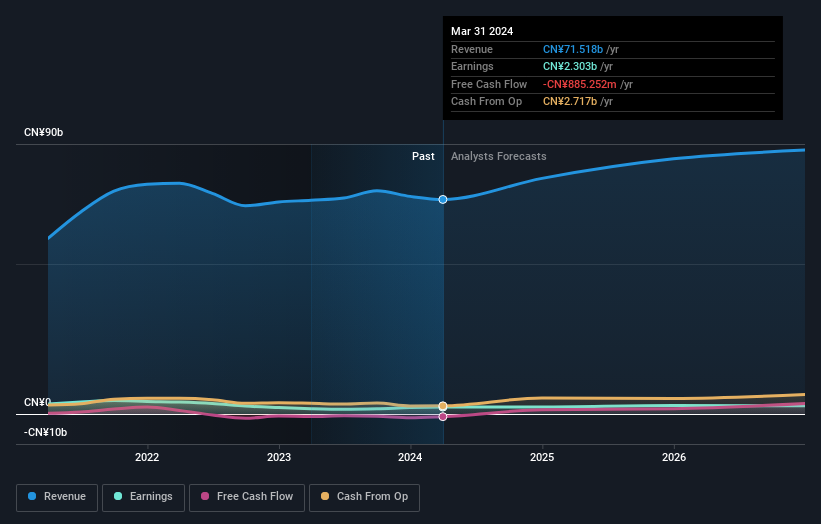
We know that Nanjing Iron & Steel has improved its bottom line lately, but what does the future have in store? So we recommend checking out this free report showing consensus forecasts
What About Dividends?
As well as measuring the share price return, investors should also consider the total shareholder return (TSR). The TSR is a return calculation that accounts for the value of cash dividends (assuming that any dividend received was reinvested) and the calculated value of any discounted capital raisings and spin-offs. Arguably, the TSR gives a more comprehensive picture of the return generated by a stock. In the case of Nanjing Iron & Steel, it has a TSR of 114% for the last 5 years. That exceeds its share price return that we previously mentioned. And there's no prize for guessing that the dividend payments largely explain the divergence!
A Different Perspective
It's good to see that Nanjing Iron & Steel has rewarded shareholders with a total shareholder return of 57% in the last twelve months. And that does include the dividend. That's better than the annualised return of 16% over half a decade, implying that the company is doing better recently. Someone with an optimistic perspective could view the recent improvement in TSR as indicating that the business itself is getting better with time. It's always interesting to track share price performance over the longer term. But to understand Nanjing Iron & Steel better, we need to consider many other factors. Case in point: We've spotted 2 warning signs for Nanjing Iron & Steel you should be aware of, and 1 of them is significant.
Of course, you might find a fantastic investment by looking elsewhere. So take a peek at this free list of companies we expect will grow earnings.
Please note, the market returns quoted in this article reflect the market weighted average returns of stocks that currently trade on Chinese exchanges.
Valuation is complex, but we're helping make it simple.
Find out whether Nanjing Iron & Steel is potentially over or undervalued by checking out our comprehensive analysis, which includes fair value estimates, risks and warnings, dividends, insider transactions and financial health.
View the Free AnalysisHave feedback on this article? Concerned about the content? Get in touch with us directly. Alternatively, email editorial-team (at) simplywallst.com.
This article by Simply Wall St is general in nature. We provide commentary based on historical data and analyst forecasts only using an unbiased methodology and our articles are not intended to be financial advice. It does not constitute a recommendation to buy or sell any stock, and does not take account of your objectives, or your financial situation. We aim to bring you long-term focused analysis driven by fundamental data. Note that our analysis may not factor in the latest price-sensitive company announcements or qualitative material. Simply Wall St has no position in any stocks mentioned.
About SHSE:600282
Nanjing Iron & Steel
Produces and sells steel products in China and internationally.
Undervalued with proven track record.

