Stock Analysis
- China
- /
- Auto Components
- /
- SZSE:002126
Zhejiang Yinlun MachineryLtd's (SZSE:002126) five-year total shareholder returns outpace the underlying earnings growth

The worst result, after buying shares in a company (assuming no leverage), would be if you lose all the money you put in. But when you pick a company that is really flourishing, you can make more than 100%. Long term Zhejiang Yinlun Machinery Co.,Ltd. (SZSE:002126) shareholders would be well aware of this, since the stock is up 129% in five years. Unfortunately, though, the stock has dropped 3.8% over a week.
Although Zhejiang Yinlun MachineryLtd has shed CN¥574m from its market cap this week, let's take a look at its longer term fundamental trends and see if they've driven returns.
Check out our latest analysis for Zhejiang Yinlun MachineryLtd
While the efficient markets hypothesis continues to be taught by some, it has been proven that markets are over-reactive dynamic systems, and investors are not always rational. One imperfect but simple way to consider how the market perception of a company has shifted is to compare the change in the earnings per share (EPS) with the share price movement.
During five years of share price growth, Zhejiang Yinlun MachineryLtd achieved compound earnings per share (EPS) growth of 13% per year. This EPS growth is slower than the share price growth of 18% per year, over the same period. This suggests that market participants hold the company in higher regard, these days. That's not necessarily surprising considering the five-year track record of earnings growth.
The graphic below depicts how EPS has changed over time (unveil the exact values by clicking on the image).
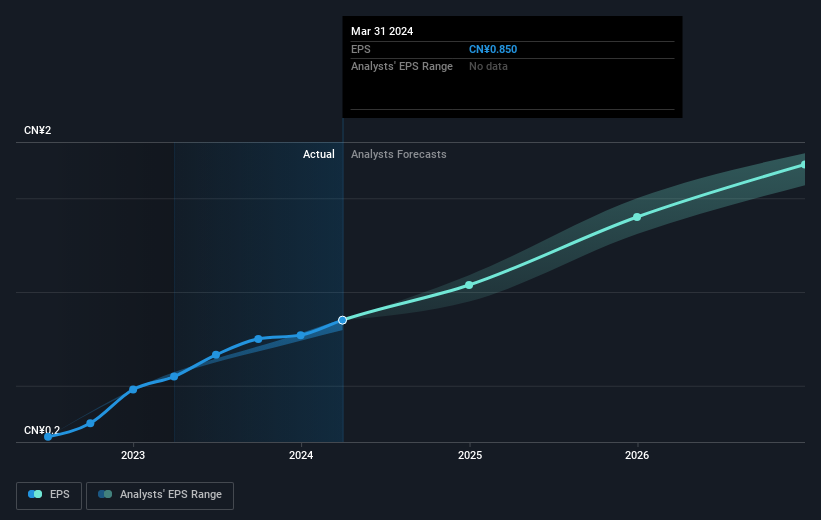
We know that Zhejiang Yinlun MachineryLtd has improved its bottom line lately, but is it going to grow revenue? If you're interested, you could check this free report showing consensus revenue forecasts.
What About Dividends?
When looking at investment returns, it is important to consider the difference between total shareholder return (TSR) and share price return. The TSR incorporates the value of any spin-offs or discounted capital raisings, along with any dividends, based on the assumption that the dividends are reinvested. It's fair to say that the TSR gives a more complete picture for stocks that pay a dividend. In the case of Zhejiang Yinlun MachineryLtd, it has a TSR of 137% for the last 5 years. That exceeds its share price return that we previously mentioned. The dividends paid by the company have thusly boosted the total shareholder return.
A Different Perspective
It's nice to see that Zhejiang Yinlun MachineryLtd shareholders have received a total shareholder return of 34% over the last year. Of course, that includes the dividend. That's better than the annualised return of 19% over half a decade, implying that the company is doing better recently. In the best case scenario, this may hint at some real business momentum, implying that now could be a great time to delve deeper. While it is well worth considering the different impacts that market conditions can have on the share price, there are other factors that are even more important. For example, we've discovered 2 warning signs for Zhejiang Yinlun MachineryLtd (1 is significant!) that you should be aware of before investing here.
Of course, you might find a fantastic investment by looking elsewhere. So take a peek at this free list of companies we expect will grow earnings.
Please note, the market returns quoted in this article reflect the market weighted average returns of stocks that currently trade on Chinese exchanges.
Valuation is complex, but we're helping make it simple.
Find out whether Zhejiang Yinlun MachineryLtd is potentially over or undervalued by checking out our comprehensive analysis, which includes fair value estimates, risks and warnings, dividends, insider transactions and financial health.
View the Free AnalysisHave feedback on this article? Concerned about the content? Get in touch with us directly. Alternatively, email editorial-team (at) simplywallst.com.
This article by Simply Wall St is general in nature. We provide commentary based on historical data and analyst forecasts only using an unbiased methodology and our articles are not intended to be financial advice. It does not constitute a recommendation to buy or sell any stock, and does not take account of your objectives, or your financial situation. We aim to bring you long-term focused analysis driven by fundamental data. Note that our analysis may not factor in the latest price-sensitive company announcements or qualitative material. Simply Wall St has no position in any stocks mentioned.
About SZSE:002126
Zhejiang Yinlun MachineryLtd
Researches, develops, manufactures, and sells thermal management and exhaust gas after-treatment products.
Good value with reasonable growth potential.

