Stock Analysis
- Chile
- /
- Food and Staples Retail
- /
- SNSE:SMU
SMU's (SNSE:SMU) 33% CAGR outpaced the company's earnings growth over the same three-year period


By buying an index fund, investors can approximate the average market return. But if you buy good businesses at attractive prices, your portfolio returns could exceed the average market return. For example, SMU S.A. (SNSE:SMU) shareholders have seen the share price rise 71% over three years, well in excess of the market return (6.2%, not including dividends). However, more recent returns haven't been as impressive as that, with the stock returning just 30% in the last year , including dividends .
After a strong gain in the past week, it's worth seeing if longer term returns have been driven by improving fundamentals.
View our latest analysis for SMU
In his essay The Superinvestors of Graham-and-Doddsville Warren Buffett described how share prices do not always rationally reflect the value of a business. One imperfect but simple way to consider how the market perception of a company has shifted is to compare the change in the earnings per share (EPS) with the share price movement.
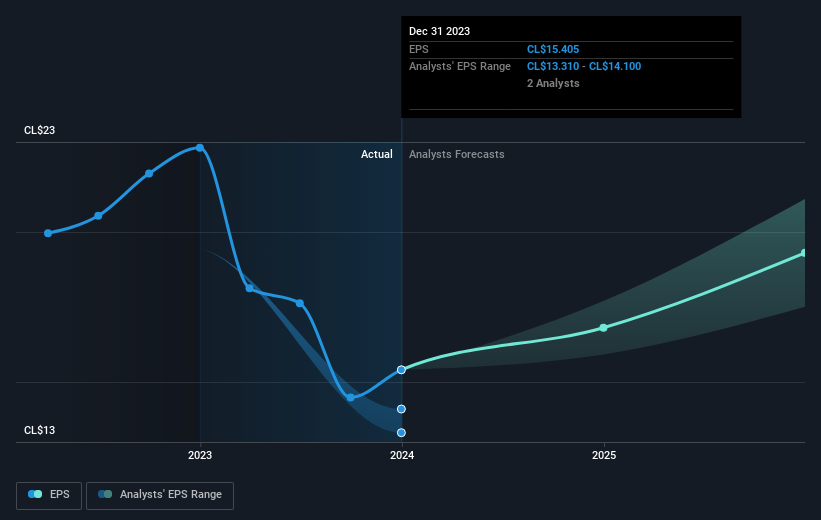
During three years of share price growth, SMU achieved compound earnings per share growth of 51% per year. This EPS growth is higher than the 20% average annual increase in the share price. So one could reasonably conclude that the market has cooled on the stock. We'd venture the lowish P/E ratio of 11.35 also reflects the negative sentiment around the stock.
You can see how EPS has changed over time in the image below (click on the chart to see the exact values).
We know that SMU has improved its bottom line over the last three years, but what does the future have in store? This free interactive report on SMU's balance sheet strength is a great place to start, if you want to investigate the stock further.
What About Dividends?
As well as measuring the share price return, investors should also consider the total shareholder return (TSR). The TSR incorporates the value of any spin-offs or discounted capital raisings, along with any dividends, based on the assumption that the dividends are reinvested. It's fair to say that the TSR gives a more complete picture for stocks that pay a dividend. In the case of SMU, it has a TSR of 136% for the last 3 years. That exceeds its share price return that we previously mentioned. The dividends paid by the company have thusly boosted the total shareholder return.
A Different Perspective
We're pleased to report that SMU shareholders have received a total shareholder return of 30% over one year. That's including the dividend. Since the one-year TSR is better than the five-year TSR (the latter coming in at 8% per year), it would seem that the stock's performance has improved in recent times. Someone with an optimistic perspective could view the recent improvement in TSR as indicating that the business itself is getting better with time. It's always interesting to track share price performance over the longer term. But to understand SMU better, we need to consider many other factors. Consider risks, for instance. Every company has them, and we've spotted 3 warning signs for SMU you should know about.
If you like to buy stocks alongside management, then you might just love this free list of companies. (Hint: insiders have been buying them).
Please note, the market returns quoted in this article reflect the market weighted average returns of stocks that currently trade on Chilean exchanges.
Valuation is complex, but we're helping make it simple.
Find out whether SMU is potentially over or undervalued by checking out our comprehensive analysis, which includes fair value estimates, risks and warnings, dividends, insider transactions and financial health.
View the Free AnalysisHave feedback on this article? Concerned about the content? Get in touch with us directly. Alternatively, email editorial-team (at) simplywallst.com.
This article by Simply Wall St is general in nature. We provide commentary based on historical data and analyst forecasts only using an unbiased methodology and our articles are not intended to be financial advice. It does not constitute a recommendation to buy or sell any stock, and does not take account of your objectives, or your financial situation. We aim to bring you long-term focused analysis driven by fundamental data. Note that our analysis may not factor in the latest price-sensitive company announcements or qualitative material. Simply Wall St has no position in any stocks mentioned.
About SNSE:SMU
Undervalued with mediocre balance sheet.
