Stock Analysis
- Canada
- /
- Telecom Services and Carriers
- /
- TSX:QBR.A
Return Trends At Quebecor (TSE:QBR.A) Aren't Appealing


If we want to find a potential multi-bagger, often there are underlying trends that can provide clues. Amongst other things, we'll want to see two things; firstly, a growing return on capital employed (ROCE) and secondly, an expansion in the company's amount of capital employed. Basically this means that a company has profitable initiatives that it can continue to reinvest in, which is a trait of a compounding machine. Although, when we looked at Quebecor (TSE:QBR.A), it didn't seem to tick all of these boxes.
What Is Return On Capital Employed (ROCE)?
If you haven't worked with ROCE before, it measures the 'return' (pre-tax profit) a company generates from capital employed in its business. The formula for this calculation on Quebecor is:
Return on Capital Employed = Earnings Before Interest and Tax (EBIT) ÷ (Total Assets - Current Liabilities)
0.14 = CA$1.3b ÷ (CA$13b - CA$3.3b) (Based on the trailing twelve months to December 2023).
Thus, Quebecor has an ROCE of 14%. On its own, that's a standard return, however it's much better than the 9.4% generated by the Telecom industry.
View our latest analysis for Quebecor
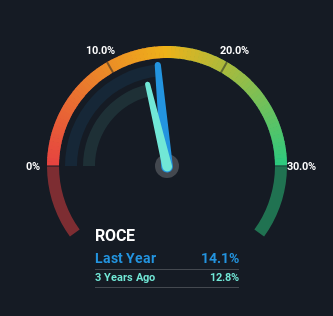
Above you can see how the current ROCE for Quebecor compares to its prior returns on capital, but there's only so much you can tell from the past. If you're interested, you can view the analysts predictions in our free analyst report for Quebecor .
How Are Returns Trending?
There hasn't been much to report for Quebecor's returns and its level of capital employed because both metrics have been steady for the past five years. It's not uncommon to see this when looking at a mature and stable business that isn't re-investing its earnings because it has likely passed that phase of the business cycle. With that in mind, unless investment picks up again in the future, we wouldn't expect Quebecor to be a multi-bagger going forward.
On another note, while the change in ROCE trend might not scream for attention, it's interesting that the current liabilities have actually gone up over the last five years. This is intriguing because if current liabilities hadn't increased to 26% of total assets, this reported ROCE would probably be less than14% because total capital employed would be higher.The 14% ROCE could be even lower if current liabilities weren't 26% of total assets, because the the formula would show a larger base of total capital employed. With that in mind, just be wary if this ratio increases in the future, because if it gets particularly high, this brings with it some new elements of risk.
What We Can Learn From Quebecor's ROCE
In a nutshell, Quebecor has been trudging along with the same returns from the same amount of capital over the last five years. Unsurprisingly, the stock has only gained 18% over the last five years, which potentially indicates that investors are accounting for this going forward. As a result, if you're hunting for a multi-bagger, we think you'd have more luck elsewhere.
If you want to continue researching Quebecor, you might be interested to know about the 1 warning sign that our analysis has discovered.
If you want to search for solid companies with great earnings, check out this free list of companies with good balance sheets and impressive returns on equity.
Valuation is complex, but we're helping make it simple.
Find out whether Quebecor is potentially over or undervalued by checking out our comprehensive analysis, which includes fair value estimates, risks and warnings, dividends, insider transactions and financial health.
View the Free AnalysisHave feedback on this article? Concerned about the content? Get in touch with us directly. Alternatively, email editorial-team (at) simplywallst.com.
This article by Simply Wall St is general in nature. We provide commentary based on historical data and analyst forecasts only using an unbiased methodology and our articles are not intended to be financial advice. It does not constitute a recommendation to buy or sell any stock, and does not take account of your objectives, or your financial situation. We aim to bring you long-term focused analysis driven by fundamental data. Note that our analysis may not factor in the latest price-sensitive company announcements or qualitative material. Simply Wall St has no position in any stocks mentioned.
About TSX:QBR.A
Quebecor
Quebecor Inc., together with its subsidiaries, operates in the telecommunications, media, and sports and entertainment businesses in Canada.
Undervalued established dividend payer.
