Stock Analysis
- Belgium
- /
- Telecom Services and Carriers
- /
- ENXTBR:PROX
Investors five-year losses continue as Proximus (EBR:PROX) dips a further 3.8% this week, earnings continue to decline


Generally speaking long term investing is the way to go. But that doesn't mean long term investors can avoid big losses. To wit, the Proximus PLC (EBR:PROX) share price managed to fall 71% over five long years. That is extremely sub-optimal, to say the least. The falls have accelerated recently, with the share price down 15% in the last three months. This could be related to the recent financial results - you can catch up on the most recent data by reading our company report.
If the past week is anything to go by, investor sentiment for Proximus isn't positive, so let's see if there's a mismatch between fundamentals and the share price.
See our latest analysis for Proximus
While markets are a powerful pricing mechanism, share prices reflect investor sentiment, not just underlying business performance. One flawed but reasonable way to assess how sentiment around a company has changed is to compare the earnings per share (EPS) with the share price.
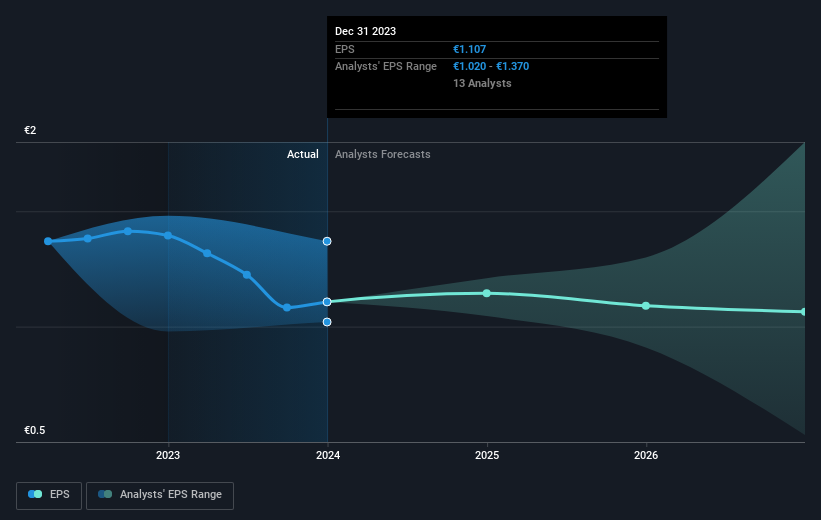
Looking back five years, both Proximus' share price and EPS declined; the latter at a rate of 6.8% per year. This reduction in EPS is less than the 22% annual reduction in the share price. This implies that the market was previously too optimistic about the stock. The less favorable sentiment is reflected in its current P/E ratio of 6.60.
You can see how EPS has changed over time in the image below (click on the chart to see the exact values).
Dive deeper into Proximus' key metrics by checking this interactive graph of Proximus's earnings, revenue and cash flow.
What About Dividends?
It is important to consider the total shareholder return, as well as the share price return, for any given stock. Whereas the share price return only reflects the change in the share price, the TSR includes the value of dividends (assuming they were reinvested) and the benefit of any discounted capital raising or spin-off. It's fair to say that the TSR gives a more complete picture for stocks that pay a dividend. In the case of Proximus, it has a TSR of -61% for the last 5 years. That exceeds its share price return that we previously mentioned. This is largely a result of its dividend payments!
A Different Perspective
Investors in Proximus had a tough year, with a total loss of 9.8% (including dividends), against a market gain of about 0.7%. However, keep in mind that even the best stocks will sometimes underperform the market over a twelve month period. However, the loss over the last year isn't as bad as the 10% per annum loss investors have suffered over the last half decade. We'd need to see some sustained improvements in the key metrics before we could muster much enthusiasm. I find it very interesting to look at share price over the long term as a proxy for business performance. But to truly gain insight, we need to consider other information, too. For instance, we've identified 3 warning signs for Proximus (2 shouldn't be ignored) that you should be aware of.
For those who like to find winning investments this free list of growing companies with recent insider purchasing, could be just the ticket.
Please note, the market returns quoted in this article reflect the market weighted average returns of stocks that currently trade on Belgian exchanges.
Valuation is complex, but we're helping make it simple.
Find out whether Proximus is potentially over or undervalued by checking out our comprehensive analysis, which includes fair value estimates, risks and warnings, dividends, insider transactions and financial health.
View the Free AnalysisHave feedback on this article? Concerned about the content? Get in touch with us directly. Alternatively, email editorial-team (at) simplywallst.com.
This article by Simply Wall St is general in nature. We provide commentary based on historical data and analyst forecasts only using an unbiased methodology and our articles are not intended to be financial advice. It does not constitute a recommendation to buy or sell any stock, and does not take account of your objectives, or your financial situation. We aim to bring you long-term focused analysis driven by fundamental data. Note that our analysis may not factor in the latest price-sensitive company announcements or qualitative material. Simply Wall St has no position in any stocks mentioned.
About ENXTBR:PROX
Proximus
Proximus PLC provides digital services and communication solutions in Belgium and internationally.
Good value with imperfect balance sheet.
