Stock Analysis
- Australia
- /
- Medical Equipment
- /
- ASX:OIL
The five-year returns have been respectable for Optiscan Imaging (ASX:OIL) shareholders despite underlying losses increasing


When we invest, we're generally looking for stocks that outperform the market average. Buying under-rated businesses is one path to excess returns. For example, long term Optiscan Imaging Limited (ASX:OIL) shareholders have enjoyed a 72% share price rise over the last half decade, well in excess of the market return of around 25% (not including dividends).
On the back of a solid 7-day performance, let's check what role the company's fundamentals have played in driving long term shareholder returns.
See our latest analysis for Optiscan Imaging
Given that Optiscan Imaging didn't make a profit in the last twelve months, we'll focus on revenue growth to form a quick view of its business development. When a company doesn't make profits, we'd generally expect to see good revenue growth. That's because fast revenue growth can be easily extrapolated to forecast profits, often of considerable size.
In the last 5 years Optiscan Imaging saw its revenue grow at 2.7% per year. Put simply, that growth rate fails to impress. The modest growth is probably broadly reflected in the share price, which is up 11%, per year over 5 years. The business could be one worth watching but we generally prefer faster revenue growth.
The graphic below depicts how earnings and revenue have changed over time (unveil the exact values by clicking on the image).
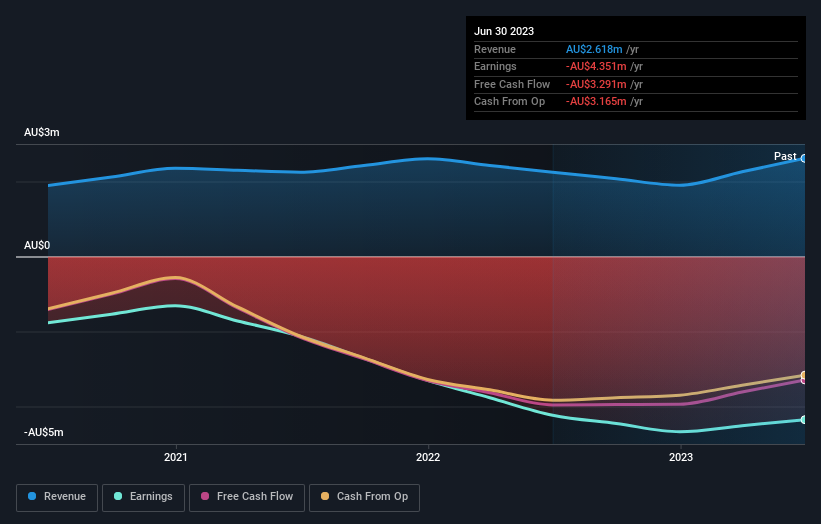
We consider it positive that insiders have made significant purchases in the last year. Even so, future earnings will be far more important to whether current shareholders make money. Dive deeper into the earnings by checking this interactive graph of Optiscan Imaging's earnings, revenue and cash flow.
What About The Total Shareholder Return (TSR)?
We've already covered Optiscan Imaging's share price action, but we should also mention its total shareholder return (TSR). Arguably the TSR is a more complete return calculation because it accounts for the value of dividends (as if they were reinvested), along with the hypothetical value of any discounted capital that have been offered to shareholders. We note that Optiscan Imaging's TSR, at 75% is higher than its share price return of 72%. When you consider it hasn't been paying a dividend, this data suggests shareholders have benefitted from a spin-off, or had the opportunity to acquire attractively priced shares in a discounted capital raising.
A Different Perspective
While the broader market gained around 6.5% in the last year, Optiscan Imaging shareholders lost 4.8%. However, keep in mind that even the best stocks will sometimes underperform the market over a twelve month period. On the bright side, long term shareholders have made money, with a gain of 12% per year over half a decade. If the fundamental data continues to indicate long term sustainable growth, the current sell-off could be an opportunity worth considering. I find it very interesting to look at share price over the long term as a proxy for business performance. But to truly gain insight, we need to consider other information, too. For example, we've discovered 5 warning signs for Optiscan Imaging (2 are significant!) that you should be aware of before investing here.
Optiscan Imaging is not the only stock that insiders are buying. For those who like to find winning investments this free list of growing companies with recent insider purchasing, could be just the ticket.
Please note, the market returns quoted in this article reflect the market weighted average returns of stocks that currently trade on Australian exchanges.
Valuation is complex, but we're helping make it simple.
Find out whether Optiscan Imaging is potentially over or undervalued by checking out our comprehensive analysis, which includes fair value estimates, risks and warnings, dividends, insider transactions and financial health.
View the Free AnalysisHave feedback on this article? Concerned about the content? Get in touch with us directly. Alternatively, email editorial-team (at) simplywallst.com.
This article by Simply Wall St is general in nature. We provide commentary based on historical data and analyst forecasts only using an unbiased methodology and our articles are not intended to be financial advice. It does not constitute a recommendation to buy or sell any stock, and does not take account of your objectives, or your financial situation. We aim to bring you long-term focused analysis driven by fundamental data. Note that our analysis may not factor in the latest price-sensitive company announcements or qualitative material. Simply Wall St has no position in any stocks mentioned.
About ASX:OIL
Optiscan Imaging
Optiscan Imaging Limited engages in the development, manufacture, and commercialization of endomicroscopic digital imaging technology solutions for medical, translational, and pre-clinical applications in Australia, Germany, and Internationally.
Excellent balance sheet with weak fundamentals.
