Stock Analysis
- Australia
- /
- Medical Equipment
- /
- ASX:ANN
Ansell's (ASX:ANN) earnings trajectory could turn positive as the stock advances 3.2% this past week


In order to justify the effort of selecting individual stocks, it's worth striving to beat the returns from a market index fund. But its virtually certain that sometimes you will buy stocks that fall short of the market average returns. Unfortunately, that's been the case for longer term Ansell Limited (ASX:ANN) shareholders, since the share price is down 35% in the last three years, falling well short of the market return of around 23%. In contrast, the stock price has popped 9.6% in the last thirty days.
On a more encouraging note the company has added AU$113m to its market cap in just the last 7 days, so let's see if we can determine what's driven the three-year loss for shareholders.
See our latest analysis for Ansell
To paraphrase Benjamin Graham: Over the short term the market is a voting machine, but over the long term it's a weighing machine. One way to examine how market sentiment has changed over time is to look at the interaction between a company's share price and its earnings per share (EPS).
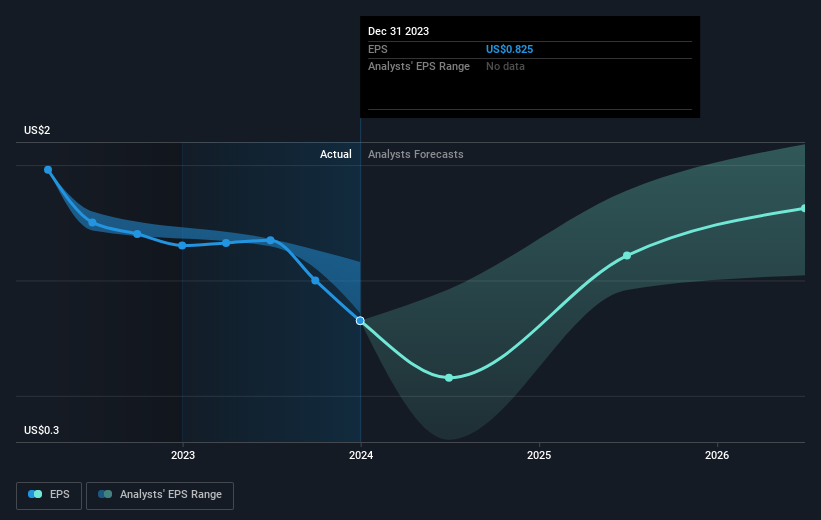
During the three years that the share price fell, Ansell's earnings per share (EPS) dropped by 22% each year. This fall in the EPS is worse than the 13% compound annual share price fall. This suggests that the market retains some optimism around long term earnings stability, despite past EPS declines.
You can see how EPS has changed over time in the image below (click on the chart to see the exact values).
We like that insiders have been buying shares in the last twelve months. Having said that, most people consider earnings and revenue growth trends to be a more meaningful guide to the business. This free interactive report on Ansell's earnings, revenue and cash flow is a great place to start, if you want to investigate the stock further.
What About Dividends?
It is important to consider the total shareholder return, as well as the share price return, for any given stock. The TSR is a return calculation that accounts for the value of cash dividends (assuming that any dividend received was reinvested) and the calculated value of any discounted capital raisings and spin-offs. Arguably, the TSR gives a more comprehensive picture of the return generated by a stock. We note that for Ansell the TSR over the last 3 years was -29%, which is better than the share price return mentioned above. The dividends paid by the company have thusly boosted the total shareholder return.
A Different Perspective
Investors in Ansell had a tough year, with a total loss of 4.5% (including dividends), against a market gain of about 10.0%. Even the share prices of good stocks drop sometimes, but we want to see improvements in the fundamental metrics of a business, before getting too interested. Longer term investors wouldn't be so upset, since they would have made 1.6%, each year, over five years. If the fundamental data continues to indicate long term sustainable growth, the current sell-off could be an opportunity worth considering. It's always interesting to track share price performance over the longer term. But to understand Ansell better, we need to consider many other factors. Consider risks, for instance. Every company has them, and we've spotted 2 warning signs for Ansell you should know about.
If you like to buy stocks alongside management, then you might just love this free list of companies. (Hint: insiders have been buying them).
Please note, the market returns quoted in this article reflect the market weighted average returns of stocks that currently trade on Australian exchanges.
Valuation is complex, but we're helping make it simple.
Find out whether Ansell is potentially over or undervalued by checking out our comprehensive analysis, which includes fair value estimates, risks and warnings, dividends, insider transactions and financial health.
View the Free AnalysisHave feedback on this article? Concerned about the content? Get in touch with us directly. Alternatively, email editorial-team (at) simplywallst.com.
This article by Simply Wall St is general in nature. We provide commentary based on historical data and analyst forecasts only using an unbiased methodology and our articles are not intended to be financial advice. It does not constitute a recommendation to buy or sell any stock, and does not take account of your objectives, or your financial situation. We aim to bring you long-term focused analysis driven by fundamental data. Note that our analysis may not factor in the latest price-sensitive company announcements or qualitative material. Simply Wall St has no position in any stocks mentioned.
About ASX:ANN
Ansell
Ansell Limited designs, develops, and manufactures protection solutions in the Asia Pacific, Europe, the Middle East, Africa, Latin America, the Caribbean, and North America.
Flawless balance sheet and undervalued.
