Stock Analysis
- Australia
- /
- Oil and Gas
- /
- ASX:TER
TerraCom Limited's (ASX:TER) Stock Has Been Sliding But Fundamentals Look Strong: Is The Market Wrong?


With its stock down 20% over the past three months, it is easy to disregard TerraCom (ASX:TER). However, a closer look at its sound financials might cause you to think again. Given that fundamentals usually drive long-term market outcomes, the company is worth looking at. In this article, we decided to focus on TerraCom's ROE.
Return on equity or ROE is a key measure used to assess how efficiently a company's management is utilizing the company's capital. Simply put, it is used to assess the profitability of a company in relation to its equity capital.
See our latest analysis for TerraCom
How To Calculate Return On Equity?
Return on equity can be calculated by using the formula:
Return on Equity = Net Profit (from continuing operations) ÷ Shareholders' Equity
So, based on the above formula, the ROE for TerraCom is:
65% = AU$114m ÷ AU$174m (Based on the trailing twelve months to December 2023).
The 'return' is the profit over the last twelve months. That means that for every A$1 worth of shareholders' equity, the company generated A$0.65 in profit.
Why Is ROE Important For Earnings Growth?
We have already established that ROE serves as an efficient profit-generating gauge for a company's future earnings. We now need to evaluate how much profit the company reinvests or "retains" for future growth which then gives us an idea about the growth potential of the company. Assuming all else is equal, companies that have both a higher return on equity and higher profit retention are usually the ones that have a higher growth rate when compared to companies that don't have the same features.
A Side By Side comparison of TerraCom's Earnings Growth And 65% ROE
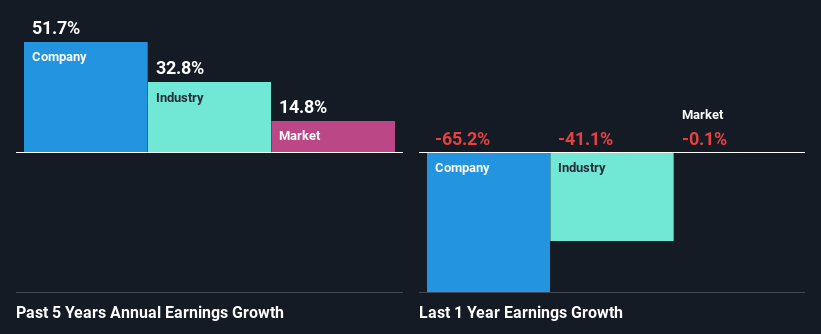
To begin with, TerraCom has a pretty high ROE which is interesting. Additionally, the company's ROE is higher compared to the industry average of 15% which is quite remarkable. So, the substantial 52% net income growth seen by TerraCom over the past five years isn't overly surprising.
As a next step, we compared TerraCom's net income growth with the industry, and pleasingly, we found that the growth seen by the company is higher than the average industry growth of 33%.
The basis for attaching value to a company is, to a great extent, tied to its earnings growth. It’s important for an investor to know whether the market has priced in the company's expected earnings growth (or decline). Doing so will help them establish if the stock's future looks promising or ominous. Is TerraCom fairly valued compared to other companies? These 3 valuation measures might help you decide.
Is TerraCom Efficiently Re-investing Its Profits?
The three-year median payout ratio for TerraCom is 49%, which is moderately low. The company is retaining the remaining 51%. This suggests that its dividend is well covered, and given the high growth we discussed above, it looks like TerraCom is reinvesting its earnings efficiently.
Additionally, TerraCom has paid dividends over a period of five years which means that the company is pretty serious about sharing its profits with shareholders.
Summary
Overall, we are quite pleased with TerraCom's performance. Particularly, we like that the company is reinvesting heavily into its business, and at a high rate of return. Unsurprisingly, this has led to an impressive earnings growth. If the company continues to grow its earnings the way it has, that could have a positive impact on its share price given how earnings per share influence long-term share prices. Not to forget, share price outcomes are also dependent on the potential risks a company may face. So it is important for investors to be aware of the risks involved in the business. To know the 2 risks we have identified for TerraCom visit our risks dashboard for free.
Valuation is complex, but we're helping make it simple.
Find out whether TerraCom is potentially over or undervalued by checking out our comprehensive analysis, which includes fair value estimates, risks and warnings, dividends, insider transactions and financial health.
View the Free AnalysisHave feedback on this article? Concerned about the content? Get in touch with us directly. Alternatively, email editorial-team (at) simplywallst.com.
This article by Simply Wall St is general in nature. We provide commentary based on historical data and analyst forecasts only using an unbiased methodology and our articles are not intended to be financial advice. It does not constitute a recommendation to buy or sell any stock, and does not take account of your objectives, or your financial situation. We aim to bring you long-term focused analysis driven by fundamental data. Note that our analysis may not factor in the latest price-sensitive company announcements or qualitative material. Simply Wall St has no position in any stocks mentioned.
About ASX:TER
Good value with mediocre balance sheet.

