Stock Analysis
- Australia
- /
- Consumer Durables
- /
- ASX:AVJ
AVJennings (ASX:AVJ) sheds AU$51m, company earnings and investor returns have been trending downwards for past five years


In order to justify the effort of selecting individual stocks, it's worth striving to beat the returns from a market index fund. But even the best stock picker will only win with some selections. So we wouldn't blame long term AVJennings Limited (ASX:AVJ) shareholders for doubting their decision to hold, with the stock down 55% over a half decade.
Since AVJennings has shed AU$51m from its value in the past 7 days, let's see if the longer term decline has been driven by the business' economics.
See our latest analysis for AVJennings
While the efficient markets hypothesis continues to be taught by some, it has been proven that markets are over-reactive dynamic systems, and investors are not always rational. By comparing earnings per share (EPS) and share price changes over time, we can get a feel for how investor attitudes to a company have morphed over time.
Looking back five years, both AVJennings' share price and EPS declined; the latter at a rate of 8.4% per year. This reduction in EPS is less than the 15% annual reduction in the share price. This implies that the market was previously too optimistic about the stock. The less favorable sentiment is reflected in its current P/E ratio of 5.34.
The image below shows how EPS has tracked over time (if you click on the image you can see greater detail).
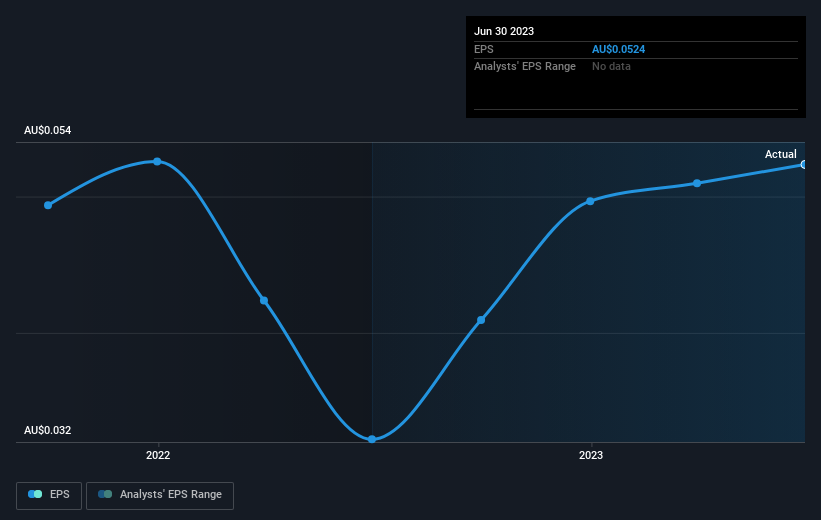
Dive deeper into AVJennings' key metrics by checking this interactive graph of AVJennings's earnings, revenue and cash flow.
What About The Total Shareholder Return (TSR)?
We'd be remiss not to mention the difference between AVJennings' total shareholder return (TSR) and its share price return. Arguably the TSR is a more complete return calculation because it accounts for the value of dividends (as if they were reinvested), along with the hypothetical value of any discounted capital that have been offered to shareholders. Its history of dividend payouts mean that AVJennings' TSR, which was a 38% drop over the last 5 years, was not as bad as the share price return.
A Different Perspective
While the broader market gained around 8.2% in the last year, AVJennings shareholders lost 17%. Even the share prices of good stocks drop sometimes, but we want to see improvements in the fundamental metrics of a business, before getting too interested. Unfortunately, last year's performance may indicate unresolved challenges, given that it was worse than the annualised loss of 7% over the last half decade. Generally speaking long term share price weakness can be a bad sign, though contrarian investors might want to research the stock in hope of a turnaround. While it is well worth considering the different impacts that market conditions can have on the share price, there are other factors that are even more important. Consider for instance, the ever-present spectre of investment risk. We've identified 2 warning signs with AVJennings (at least 1 which is significant) , and understanding them should be part of your investment process.
If you like to buy stocks alongside management, then you might just love this free list of companies. (Hint: insiders have been buying them).
Please note, the market returns quoted in this article reflect the market weighted average returns of stocks that currently trade on Australian exchanges.
Valuation is complex, but we're helping make it simple.
Find out whether AVJennings is potentially over or undervalued by checking out our comprehensive analysis, which includes fair value estimates, risks and warnings, dividends, insider transactions and financial health.
View the Free AnalysisHave feedback on this article? Concerned about the content? Get in touch with us directly. Alternatively, email editorial-team (at) simplywallst.com.
This article by Simply Wall St is general in nature. We provide commentary based on historical data and analyst forecasts only using an unbiased methodology and our articles are not intended to be financial advice. It does not constitute a recommendation to buy or sell any stock, and does not take account of your objectives, or your financial situation. We aim to bring you long-term focused analysis driven by fundamental data. Note that our analysis may not factor in the latest price-sensitive company announcements or qualitative material. Simply Wall St has no position in any stocks mentioned.
About ASX:AVJ
AVJennings
Engages in the development of residential properties in Australia.
Questionable track record with imperfect balance sheet.

