Stock Analysis
- United States
- /
- Specialty Stores
- /
- NYSE:DKS
Investing in DICK'S Sporting Goods (NYSE:DKS) five years ago would have delivered you a 533% gain


Buying shares in the best businesses can build meaningful wealth for you and your family. And we've seen some truly amazing gains over the years. To wit, the DICK'S Sporting Goods, Inc. (NYSE:DKS) share price has soared 434% over five years. And this is just one example of the epic gains achieved by some long term investors. On top of that, the share price is up 47% in about a quarter. The company reported its financial results recently; you can catch up on the latest numbers by reading our company report.
Let's take a look at the underlying fundamentals over the longer term, and see if they've been consistent with shareholders returns.
Check out our latest analysis for DICK'S Sporting Goods
While markets are a powerful pricing mechanism, share prices reflect investor sentiment, not just underlying business performance. By comparing earnings per share (EPS) and share price changes over time, we can get a feel for how investor attitudes to a company have morphed over time.
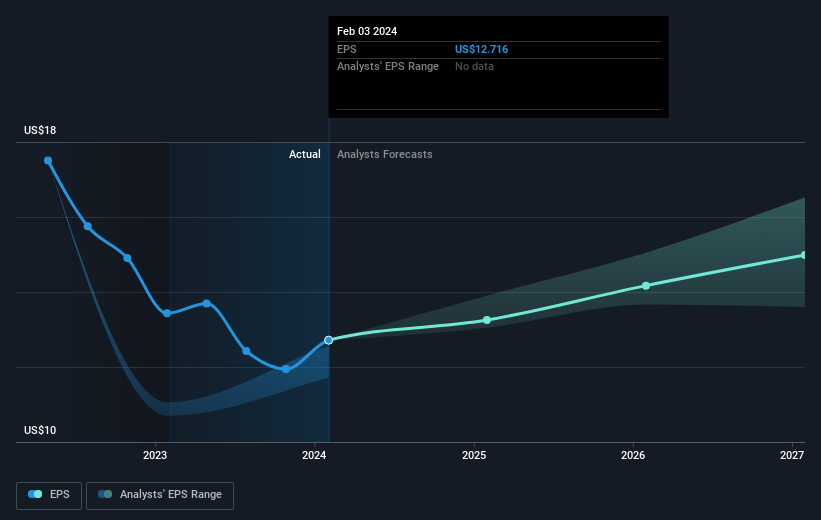
During five years of share price growth, DICK'S Sporting Goods achieved compound earnings per share (EPS) growth of 31% per year. This EPS growth is slower than the share price growth of 40% per year, over the same period. This suggests that market participants hold the company in higher regard, these days. And that's hardly shocking given the track record of growth.
The image below shows how EPS has tracked over time (if you click on the image you can see greater detail).
We consider it positive that insiders have made significant purchases in the last year. Having said that, most people consider earnings and revenue growth trends to be a more meaningful guide to the business. Before buying or selling a stock, we always recommend a close examination of historic growth trends, available here..
What About Dividends?
When looking at investment returns, it is important to consider the difference between total shareholder return (TSR) and share price return. The TSR is a return calculation that accounts for the value of cash dividends (assuming that any dividend received was reinvested) and the calculated value of any discounted capital raisings and spin-offs. Arguably, the TSR gives a more comprehensive picture of the return generated by a stock. In the case of DICK'S Sporting Goods, it has a TSR of 533% for the last 5 years. That exceeds its share price return that we previously mentioned. And there's no prize for guessing that the dividend payments largely explain the divergence!
A Different Perspective
It's nice to see that DICK'S Sporting Goods shareholders have received a total shareholder return of 55% over the last year. And that does include the dividend. Since the one-year TSR is better than the five-year TSR (the latter coming in at 45% per year), it would seem that the stock's performance has improved in recent times. In the best case scenario, this may hint at some real business momentum, implying that now could be a great time to delve deeper. It's always interesting to track share price performance over the longer term. But to understand DICK'S Sporting Goods better, we need to consider many other factors. Take risks, for example - DICK'S Sporting Goods has 1 warning sign we think you should be aware of.
If you like to buy stocks alongside management, then you might just love this free list of companies. (Hint: insiders have been buying them).
Please note, the market returns quoted in this article reflect the market weighted average returns of stocks that currently trade on American exchanges.
Valuation is complex, but we're helping make it simple.
Find out whether DICK'S Sporting Goods is potentially over or undervalued by checking out our comprehensive analysis, which includes fair value estimates, risks and warnings, dividends, insider transactions and financial health.
View the Free AnalysisHave feedback on this article? Concerned about the content? Get in touch with us directly. Alternatively, email editorial-team (at) simplywallst.com.
This article by Simply Wall St is general in nature. We provide commentary based on historical data and analyst forecasts only using an unbiased methodology and our articles are not intended to be financial advice. It does not constitute a recommendation to buy or sell any stock, and does not take account of your objectives, or your financial situation. We aim to bring you long-term focused analysis driven by fundamental data. Note that our analysis may not factor in the latest price-sensitive company announcements or qualitative material. Simply Wall St has no position in any stocks mentioned.
About NYSE:DKS
DICK'S Sporting Goods
DICK'S Sporting Goods, Inc., together with its subsidiaries, operates as an omni-channel sporting goods retailer primarily in the United States.
Flawless balance sheet established dividend payer.
