Stock Analysis
- United States
- /
- Machinery
- /
- NYSE:B
Barnes Group Inc.'s (NYSE:B) Stock's Been Going Strong: Could Weak Financials Mean The Market Will Correct Its Share Price?


Most readers would already be aware that Barnes Group's (NYSE:B) stock increased significantly by 12% over the past three months. However, in this article, we decided to focus on its weak fundamentals, as long-term financial performance of a business is what ultimately dictates market outcomes. Particularly, we will be paying attention to Barnes Group's ROE today.
Return on Equity or ROE is a test of how effectively a company is growing its value and managing investors’ money. Simply put, it is used to assess the profitability of a company in relation to its equity capital.
View our latest analysis for Barnes Group
How Is ROE Calculated?
Return on equity can be calculated by using the formula:
Return on Equity = Net Profit (from continuing operations) ÷ Shareholders' Equity
So, based on the above formula, the ROE for Barnes Group is:
1.2% = US$16m ÷ US$1.4b (Based on the trailing twelve months to December 2023).
The 'return' refers to a company's earnings over the last year. Another way to think of that is that for every $1 worth of equity, the company was able to earn $0.01 in profit.
Why Is ROE Important For Earnings Growth?
So far, we've learned that ROE is a measure of a company's profitability. We now need to evaluate how much profit the company reinvests or "retains" for future growth which then gives us an idea about the growth potential of the company. Generally speaking, other things being equal, firms with a high return on equity and profit retention, have a higher growth rate than firms that don’t share these attributes.
A Side By Side comparison of Barnes Group's Earnings Growth And 1.2% ROE
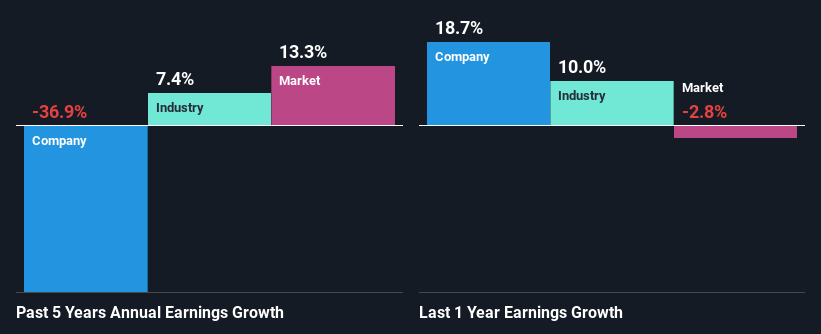
It is quite clear that Barnes Group's ROE is rather low. Even when compared to the industry average of 13%, the ROE figure is pretty disappointing. Given the circumstances, the significant decline in net income by 37% seen by Barnes Group over the last five years is not surprising. We reckon that there could also be other factors at play here. For example, the business has allocated capital poorly, or that the company has a very high payout ratio.
However, when we compared Barnes Group's growth with the industry we found that while the company's earnings have been shrinking, the industry has seen an earnings growth of 7.4% in the same period. This is quite worrisome.
Earnings growth is a huge factor in stock valuation. It’s important for an investor to know whether the market has priced in the company's expected earnings growth (or decline). Doing so will help them establish if the stock's future looks promising or ominous. What is B worth today? The intrinsic value infographic in our free research report helps visualize whether B is currently mispriced by the market.
Is Barnes Group Efficiently Re-investing Its Profits?
Barnes Group's declining earnings is not surprising given how the company is spending most of its profits in paying dividends, judging by its three-year median payout ratio of 61% (or a retention ratio of 39%). With only a little being reinvested into the business, earnings growth would obviously be low or non-existent. Our risks dashboard should have the 3 risks we have identified for Barnes Group.
Additionally, Barnes Group has paid dividends over a period of at least ten years, which means that the company's management is determined to pay dividends even if it means little to no earnings growth. Upon studying the latest analysts' consensus data, we found that the company's future payout ratio is expected to drop to 25% over the next three years.
Conclusion
Overall, we would be extremely cautious before making any decision on Barnes Group. As a result of its low ROE and lack of much reinvestment into the business, the company has seen a disappointing earnings growth rate. That being so, the latest industry analyst forecasts show that the analysts are expecting to see a huge improvement in the company's earnings growth rate. Are these analysts expectations based on the broad expectations for the industry, or on the company's fundamentals? Click here to be taken to our analyst's forecasts page for the company.
Valuation is complex, but we're helping make it simple.
Find out whether Barnes Group is potentially over or undervalued by checking out our comprehensive analysis, which includes fair value estimates, risks and warnings, dividends, insider transactions and financial health.
View the Free AnalysisHave feedback on this article? Concerned about the content? Get in touch with us directly. Alternatively, email editorial-team (at) simplywallst.com.
This article by Simply Wall St is general in nature. We provide commentary based on historical data and analyst forecasts only using an unbiased methodology and our articles are not intended to be financial advice. It does not constitute a recommendation to buy or sell any stock, and does not take account of your objectives, or your financial situation. We aim to bring you long-term focused analysis driven by fundamental data. Note that our analysis may not factor in the latest price-sensitive company announcements or qualitative material. Simply Wall St has no position in any stocks mentioned.
About NYSE:B
Barnes Group
Barnes Group Inc. provides engineered products, industrial technologies, and solutions in the United States and internationally.
Undervalued with moderate growth potential.
