Stock Analysis
- Malaysia
- /
- Healthcare Services
- /
- KLSE:UMC
Is UMediC Group Berhad's (KLSE:UMC) Latest Stock Performance A Reflection Of Its Financial Health?


UMediC Group Berhad (KLSE:UMC) has had a great run on the share market with its stock up by a significant 14% over the last week. Since the market usually pay for a company’s long-term fundamentals, we decided to study the company’s key performance indicators to see if they could be influencing the market. In this article, we decided to focus on UMediC Group Berhad's ROE.
ROE or return on equity is a useful tool to assess how effectively a company can generate returns on the investment it received from its shareholders. In short, ROE shows the profit each dollar generates with respect to its shareholder investments.
Check out our latest analysis for UMediC Group Berhad
How Do You Calculate Return On Equity?
The formula for ROE is:
Return on Equity = Net Profit (from continuing operations) ÷ Shareholders' Equity
So, based on the above formula, the ROE for UMediC Group Berhad is:
15% = RM10m ÷ RM68m (Based on the trailing twelve months to January 2024).
The 'return' refers to a company's earnings over the last year. Another way to think of that is that for every MYR1 worth of equity, the company was able to earn MYR0.15 in profit.
What Has ROE Got To Do With Earnings Growth?
We have already established that ROE serves as an efficient profit-generating gauge for a company's future earnings. We now need to evaluate how much profit the company reinvests or "retains" for future growth which then gives us an idea about the growth potential of the company. Assuming all else is equal, companies that have both a higher return on equity and higher profit retention are usually the ones that have a higher growth rate when compared to companies that don't have the same features.
A Side By Side comparison of UMediC Group Berhad's Earnings Growth And 15% ROE
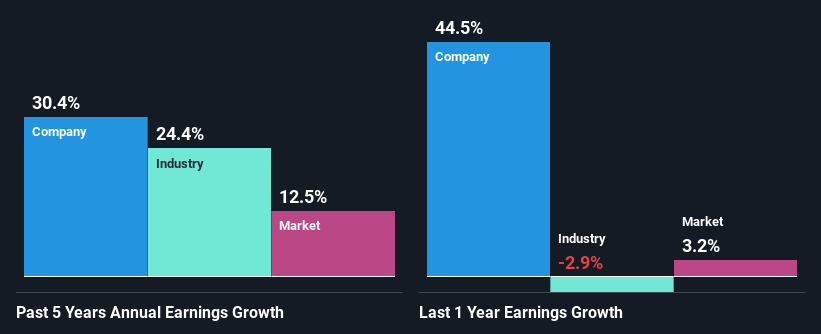
To begin with, UMediC Group Berhad seems to have a respectable ROE. Especially when compared to the industry average of 11% the company's ROE looks pretty impressive. This certainly adds some context to UMediC Group Berhad's exceptional 30% net income growth seen over the past five years. We reckon that there could also be other factors at play here. For instance, the company has a low payout ratio or is being managed efficiently.
Next, on comparing with the industry net income growth, we found that UMediC Group Berhad's growth is quite high when compared to the industry average growth of 24% in the same period, which is great to see.
Earnings growth is a huge factor in stock valuation. The investor should try to establish if the expected growth or decline in earnings, whichever the case may be, is priced in. By doing so, they will have an idea if the stock is headed into clear blue waters or if swampy waters await. What is UMC worth today? The intrinsic value infographic in our free research report helps visualize whether UMC is currently mispriced by the market.
Is UMediC Group Berhad Making Efficient Use Of Its Profits?
UMediC Group Berhad doesn't pay any regular dividends to its shareholders, meaning that the company has been reinvesting all of its profits into the business. This is likely what's driving the high earnings growth number discussed above.
Conclusion
Overall, we are quite pleased with UMediC Group Berhad's performance. Particularly, we like that the company is reinvesting heavily into its business, and at a high rate of return. Unsurprisingly, this has led to an impressive earnings growth. That being so, a study of the latest analyst forecasts show that the company is expected to see a slowdown in its future earnings growth. To know more about the latest analysts predictions for the company, check out this visualization of analyst forecasts for the company.
Valuation is complex, but we're helping make it simple.
Find out whether UMediC Group Berhad is potentially over or undervalued by checking out our comprehensive analysis, which includes fair value estimates, risks and warnings, dividends, insider transactions and financial health.
View the Free AnalysisHave feedback on this article? Concerned about the content? Get in touch with us directly. Alternatively, email editorial-team (at) simplywallst.com.
This article by Simply Wall St is general in nature. We provide commentary based on historical data and analyst forecasts only using an unbiased methodology and our articles are not intended to be financial advice. It does not constitute a recommendation to buy or sell any stock, and does not take account of your objectives, or your financial situation. We aim to bring you long-term focused analysis driven by fundamental data. Note that our analysis may not factor in the latest price-sensitive company announcements or qualitative material. Simply Wall St has no position in any stocks mentioned.
About KLSE:UMC
UMediC Group Berhad
UMediC Group Berhad, an investment holding company, develops, manufactures, markets, and distributes medical devices in Malaysia, the Asia Pacific, the Americas, Europe, the Middle East, Africa, and Oceania.
Excellent balance sheet with reasonable growth potential.
