Stock Analysis
- United States
- /
- Medical Equipment
- /
- NasdaqGM:TNDM
Tandem Diabetes Care, Inc.'s (NASDAQ:TNDM) 26% Jump Shows Its Popularity With Investors

Tandem Diabetes Care, Inc. (NASDAQ:TNDM) shares have continued their recent momentum with a 26% gain in the last month alone. Looking back a bit further, it's encouraging to see the stock is up 37% in the last year.
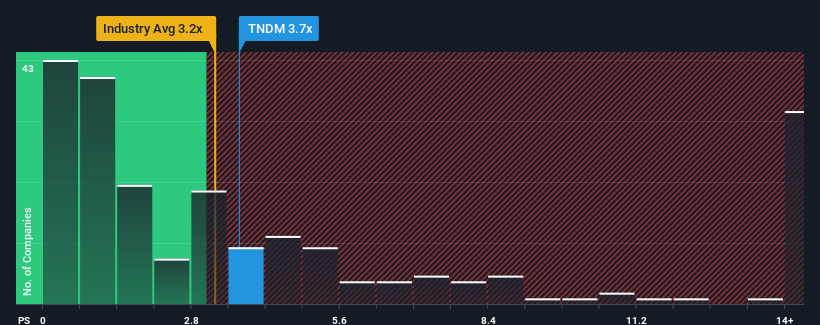
Even after such a large jump in price, it's still not a stretch to say that Tandem Diabetes Care's price-to-sales (or "P/S") ratio of 3.7x right now seems quite "middle-of-the-road" compared to the Medical Equipment industry in the United States, where the median P/S ratio is around 3.2x. While this might not raise any eyebrows, if the P/S ratio is not justified investors could be missing out on a potential opportunity or ignoring looming disappointment.
Check out our latest analysis for Tandem Diabetes Care
What Does Tandem Diabetes Care's Recent Performance Look Like?
Tandem Diabetes Care hasn't been tracking well recently as its declining revenue compares poorly to other companies, which have seen some growth in their revenues on average. It might be that many expect the dour revenue performance to strengthen positively, which has kept the P/S from falling. You'd really hope so, otherwise you're paying a relatively elevated price for a company with this sort of growth profile.
If you'd like to see what analysts are forecasting going forward, you should check out our free report on Tandem Diabetes Care.Is There Some Revenue Growth Forecasted For Tandem Diabetes Care?
Tandem Diabetes Care's P/S ratio would be typical for a company that's only expected to deliver moderate growth, and importantly, perform in line with the industry.
In reviewing the last year of financials, we were disheartened to see the company's revenues fell to the tune of 3.1%. However, a few very strong years before that means that it was still able to grow revenue by an impressive 42% in total over the last three years. Although it's been a bumpy ride, it's still fair to say the revenue growth recently has been more than adequate for the company.
Shifting to the future, estimates from the analysts covering the company suggest revenue should grow by 12% per annum over the next three years. Meanwhile, the rest of the industry is forecast to expand by 10% per year, which is not materially different.
With this in mind, it makes sense that Tandem Diabetes Care's P/S is closely matching its industry peers. It seems most investors are expecting to see average future growth and are only willing to pay a moderate amount for the stock.
What Does Tandem Diabetes Care's P/S Mean For Investors?
Tandem Diabetes Care's stock has a lot of momentum behind it lately, which has brought its P/S level with the rest of the industry. Generally, our preference is to limit the use of the price-to-sales ratio to establishing what the market thinks about the overall health of a company.
A Tandem Diabetes Care's P/S seems about right to us given the knowledge that analysts are forecasting a revenue outlook that is similar to the Medical Equipment industry. At this stage investors feel the potential for an improvement or deterioration in revenue isn't great enough to push P/S in a higher or lower direction. All things considered, if the P/S and revenue estimates contain no major shocks, then it's hard to see the share price moving strongly in either direction in the near future.
There are also other vital risk factors to consider before investing and we've discovered 2 warning signs for Tandem Diabetes Care that you should be aware of.
Of course, profitable companies with a history of great earnings growth are generally safer bets. So you may wish to see this free collection of other companies that have reasonable P/E ratios and have grown earnings strongly.
Valuation is complex, but we're helping make it simple.
Find out whether Tandem Diabetes Care is potentially over or undervalued by checking out our comprehensive analysis, which includes fair value estimates, risks and warnings, dividends, insider transactions and financial health.
View the Free AnalysisHave feedback on this article? Concerned about the content? Get in touch with us directly. Alternatively, email editorial-team (at) simplywallst.com.
This article by Simply Wall St is general in nature. We provide commentary based on historical data and analyst forecasts only using an unbiased methodology and our articles are not intended to be financial advice. It does not constitute a recommendation to buy or sell any stock, and does not take account of your objectives, or your financial situation. We aim to bring you long-term focused analysis driven by fundamental data. Note that our analysis may not factor in the latest price-sensitive company announcements or qualitative material. Simply Wall St has no position in any stocks mentioned.
About NasdaqGM:TNDM
Tandem Diabetes Care
A medical device company, designs, develops, and commercializes technology solutions for people living with diabetes in the United States and internationally.
Adequate balance sheet with concerning outlook.

