Stock Analysis
- United States
- /
- Diversified Financial
- /
- NasdaqCM:IMXI
While shareholders of International Money Express (NASDAQ:IMXI) are in the black over 5 years, those who bought a week ago aren't so fortunate


International Money Express, Inc. (NASDAQ:IMXI) shareholders have seen the share price descend 11% over the month. On the bright side the share price is up over the last half decade. Unfortunately its return of 69% is below the market return of 85%. While the long term returns are impressive, we do have some sympathy for those who bought more recently, given the 18% drop, in the last year.
In light of the stock dropping 7.6% in the past week, we want to investigate the longer term story, and see if fundamentals have been the driver of the company's positive five-year return.
Check out our latest analysis for International Money Express
There is no denying that markets are sometimes efficient, but prices do not always reflect underlying business performance. By comparing earnings per share (EPS) and share price changes over time, we can get a feel for how investor attitudes to a company have morphed over time.
During the five years of share price growth, International Money Express moved from a loss to profitability. That would generally be considered a positive, so we'd hope to see the share price to rise. Since the company was unprofitable five years ago, but not three years ago, it's worth taking a look at the returns in the last three years, too. Indeed, the International Money Express share price has gained 31% in three years. Meanwhile, EPS is up 27% per year. This EPS growth is higher than the 9% average annual increase in the share price over the same three years. So you might conclude the market is a little more cautious about the stock, these days. This cautious sentiment is reflected in its (fairly low) P/E ratio of 11.13.
You can see below how EPS has changed over time (discover the exact values by clicking on the image).
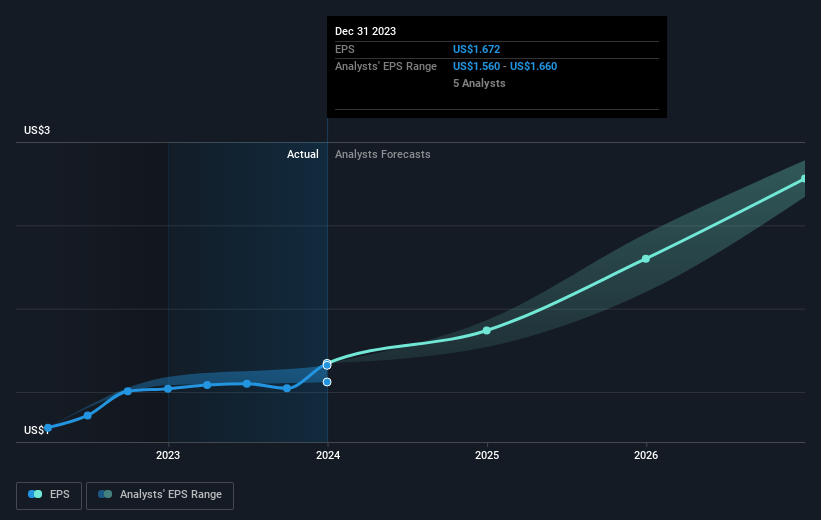
We know that International Money Express has improved its bottom line lately, but is it going to grow revenue? If you're interested, you could check this free report showing consensus revenue forecasts.
A Different Perspective
While the broader market gained around 24% in the last year, International Money Express shareholders lost 18%. However, keep in mind that even the best stocks will sometimes underperform the market over a twelve month period. On the bright side, long term shareholders have made money, with a gain of 11% per year over half a decade. It could be that the recent sell-off is an opportunity, so it may be worth checking the fundamental data for signs of a long term growth trend. Most investors take the time to check the data on insider transactions. You can click here to see if insiders have been buying or selling.
If you would prefer to check out another company -- one with potentially superior financials -- then do not miss this free list of companies that have proven they can grow earnings.
Please note, the market returns quoted in this article reflect the market weighted average returns of stocks that currently trade on American exchanges.
Valuation is complex, but we're helping make it simple.
Find out whether International Money Express is potentially over or undervalued by checking out our comprehensive analysis, which includes fair value estimates, risks and warnings, dividends, insider transactions and financial health.
View the Free AnalysisHave feedback on this article? Concerned about the content? Get in touch with us directly. Alternatively, email editorial-team (at) simplywallst.com.
This article by Simply Wall St is general in nature. We provide commentary based on historical data and analyst forecasts only using an unbiased methodology and our articles are not intended to be financial advice. It does not constitute a recommendation to buy or sell any stock, and does not take account of your objectives, or your financial situation. We aim to bring you long-term focused analysis driven by fundamental data. Note that our analysis may not factor in the latest price-sensitive company announcements or qualitative material. Simply Wall St has no position in any stocks mentioned.
About NasdaqCM:IMXI
International Money Express
Operates as an omnichannel money remittance services company in the United States, Latin America, Mexico, Central and South America, the Caribbean, Africa, and Asia.
Very undervalued with flawless balance sheet.

