Stock Analysis
The total return for Lotus Pharmaceutical (TWSE:1795) investors has risen faster than earnings growth over the last three years

It might be of some concern to shareholders to see the Lotus Pharmaceutical Co., Ltd. (TWSE:1795) share price down 12% in the last month. In contrast, the return over three years has been impressive. In three years the stock price has launched 283% higher: a great result. To some, the recent share price pullback wouldn't be surprising after such a good run. The thing to consider is whether the underlying business is doing well enough to support the current price.
While this past week has detracted from the company's three-year return, let's look at the recent trends of the underlying business and see if the gains have been in alignment.
See our latest analysis for Lotus Pharmaceutical
To quote Buffett, 'Ships will sail around the world but the Flat Earth Society will flourish. There will continue to be wide discrepancies between price and value in the marketplace...' By comparing earnings per share (EPS) and share price changes over time, we can get a feel for how investor attitudes to a company have morphed over time.
Lotus Pharmaceutical was able to grow its EPS at 54% per year over three years, sending the share price higher. This EPS growth is remarkably close to the 56% average annual increase in the share price. This observation indicates that the market's attitude to the business hasn't changed all that much. Rather, the share price has approximately tracked EPS growth.
The graphic below depicts how EPS has changed over time (unveil the exact values by clicking on the image).
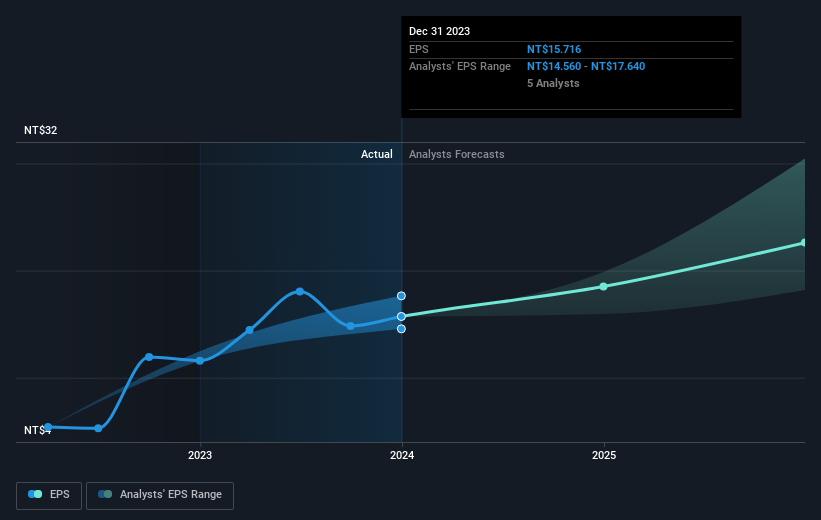
We know that Lotus Pharmaceutical has improved its bottom line over the last three years, but what does the future have in store? It might be well worthwhile taking a look at our free report on how its financial position has changed over time.
What About Dividends?
When looking at investment returns, it is important to consider the difference between total shareholder return (TSR) and share price return. Whereas the share price return only reflects the change in the share price, the TSR includes the value of dividends (assuming they were reinvested) and the benefit of any discounted capital raising or spin-off. Arguably, the TSR gives a more comprehensive picture of the return generated by a stock. As it happens, Lotus Pharmaceutical's TSR for the last 3 years was 294%, which exceeds the share price return mentioned earlier. This is largely a result of its dividend payments!
A Different Perspective
Lotus Pharmaceutical provided a TSR of 0.7% over the last twelve months. But that return falls short of the market. On the bright side, the longer term returns (running at about 24% a year, over half a decade) look better. It may well be that this is a business worth popping on the watching, given the continuing positive reception, over time, from the market. I find it very interesting to look at share price over the long term as a proxy for business performance. But to truly gain insight, we need to consider other information, too. For example, we've discovered 2 warning signs for Lotus Pharmaceutical that you should be aware of before investing here.
Of course, you might find a fantastic investment by looking elsewhere. So take a peek at this free list of companies we expect will grow earnings.
Please note, the market returns quoted in this article reflect the market weighted average returns of stocks that currently trade on Taiwanese exchanges.
Valuation is complex, but we're helping make it simple.
Find out whether Lotus Pharmaceutical is potentially over or undervalued by checking out our comprehensive analysis, which includes fair value estimates, risks and warnings, dividends, insider transactions and financial health.
View the Free AnalysisHave feedback on this article? Concerned about the content? Get in touch with us directly. Alternatively, email editorial-team (at) simplywallst.com.
This article by Simply Wall St is general in nature. We provide commentary based on historical data and analyst forecasts only using an unbiased methodology and our articles are not intended to be financial advice. It does not constitute a recommendation to buy or sell any stock, and does not take account of your objectives, or your financial situation. We aim to bring you long-term focused analysis driven by fundamental data. Note that our analysis may not factor in the latest price-sensitive company announcements or qualitative material. Simply Wall St has no position in any stocks mentioned.
About TWSE:1795
Lotus Pharmaceutical
Engages in the research and development, manufacture, and sale of generic pharmaceutical products in Taiwan, South Korea, the United States, and internationally.
Undervalued with solid track record.

