Stock Analysis
Investors in Nan Ya Plastics (TWSE:1303) have unfortunately lost 23% over the last three years


In order to justify the effort of selecting individual stocks, it's worth striving to beat the returns from a market index fund. But in any portfolio, there are likely to be some stocks that fall short of that benchmark. We regret to report that long term Nan Ya Plastics Corporation (TWSE:1303) shareholders have had that experience, with the share price dropping 34% in three years, versus a market return of about 29%. And over the last year the share price fell 26%, so we doubt many shareholders are delighted.
Now let's have a look at the company's fundamentals, and see if the long term shareholder return has matched the performance of the underlying business.
Check out our latest analysis for Nan Ya Plastics
To paraphrase Benjamin Graham: Over the short term the market is a voting machine, but over the long term it's a weighing machine. One imperfect but simple way to consider how the market perception of a company has shifted is to compare the change in the earnings per share (EPS) with the share price movement.
Nan Ya Plastics saw its EPS decline at a compound rate of 37% per year, over the last three years. In comparison the 13% compound annual share price decline isn't as bad as the EPS drop-off. This suggests that the market retains some optimism around long term earnings stability, despite past EPS declines. This positive sentiment is also reflected in the generous P/E ratio of 72.39.
The graphic below depicts how EPS has changed over time (unveil the exact values by clicking on the image).
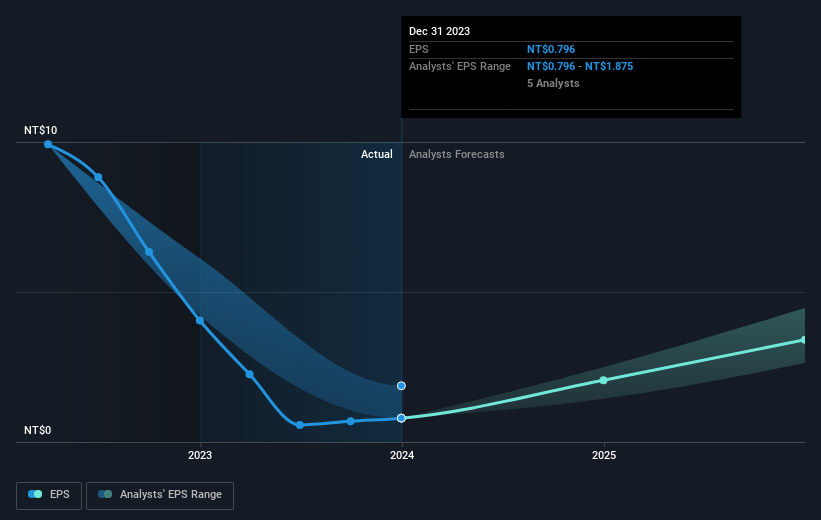
Dive deeper into Nan Ya Plastics' key metrics by checking this interactive graph of Nan Ya Plastics's earnings, revenue and cash flow.
What About Dividends?
As well as measuring the share price return, investors should also consider the total shareholder return (TSR). The TSR incorporates the value of any spin-offs or discounted capital raisings, along with any dividends, based on the assumption that the dividends are reinvested. So for companies that pay a generous dividend, the TSR is often a lot higher than the share price return. In the case of Nan Ya Plastics, it has a TSR of -23% for the last 3 years. That exceeds its share price return that we previously mentioned. And there's no prize for guessing that the dividend payments largely explain the divergence!
A Different Perspective
Investors in Nan Ya Plastics had a tough year, with a total loss of 23% (including dividends), against a market gain of about 32%. However, keep in mind that even the best stocks will sometimes underperform the market over a twelve month period. Regrettably, last year's performance caps off a bad run, with the shareholders facing a total loss of 0.7% per year over five years. We realise that Baron Rothschild has said investors should "buy when there is blood on the streets", but we caution that investors should first be sure they are buying a high quality business. It's always interesting to track share price performance over the longer term. But to understand Nan Ya Plastics better, we need to consider many other factors. Like risks, for instance. Every company has them, and we've spotted 2 warning signs for Nan Ya Plastics (of which 1 doesn't sit too well with us!) you should know about.
But note: Nan Ya Plastics may not be the best stock to buy. So take a peek at this free list of interesting companies with past earnings growth (and further growth forecast).
Please note, the market returns quoted in this article reflect the market weighted average returns of stocks that currently trade on Taiwanese exchanges.
Valuation is complex, but we're helping make it simple.
Find out whether Nan Ya Plastics is potentially over or undervalued by checking out our comprehensive analysis, which includes fair value estimates, risks and warnings, dividends, insider transactions and financial health.
View the Free AnalysisHave feedback on this article? Concerned about the content? Get in touch with us directly. Alternatively, email editorial-team (at) simplywallst.com.
This article by Simply Wall St is general in nature. We provide commentary based on historical data and analyst forecasts only using an unbiased methodology and our articles are not intended to be financial advice. It does not constitute a recommendation to buy or sell any stock, and does not take account of your objectives, or your financial situation. We aim to bring you long-term focused analysis driven by fundamental data. Note that our analysis may not factor in the latest price-sensitive company announcements or qualitative material. Simply Wall St has no position in any stocks mentioned.
About TWSE:1303
Nan Ya Plastics
Engages in the manufacture and sale of plastic products, polyester fibers, petrochemical products, and electronic materials in Taiwan, China and Hong Kong, the United States, and internationally.
Adequate balance sheet with moderate growth potential.

