Stock Analysis
- Netherlands
- /
- Construction
- /
- ENXTAM:FUR
Are Robust Financials Driving The Recent Rally In Fugro N.V.'s (AMS:FUR) Stock?


Most readers would already be aware that Fugro's (AMS:FUR) stock increased significantly by 35% over the past three months. Given the company's impressive performance, we decided to study its financial indicators more closely as a company's financial health over the long-term usually dictates market outcomes. Specifically, we decided to study Fugro's ROE in this article.
Return on equity or ROE is an important factor to be considered by a shareholder because it tells them how effectively their capital is being reinvested. In other words, it is a profitability ratio which measures the rate of return on the capital provided by the company's shareholders.
View our latest analysis for Fugro
How Do You Calculate Return On Equity?
The formula for return on equity is:
Return on Equity = Net Profit (from continuing operations) ÷ Shareholders' Equity
So, based on the above formula, the ROE for Fugro is:
20% = €257m ÷ €1.3b (Based on the trailing twelve months to December 2023).
The 'return' is the amount earned after tax over the last twelve months. One way to conceptualize this is that for each €1 of shareholders' capital it has, the company made €0.20 in profit.
Why Is ROE Important For Earnings Growth?
Thus far, we have learned that ROE measures how efficiently a company is generating its profits. Based on how much of its profits the company chooses to reinvest or "retain", we are then able to evaluate a company's future ability to generate profits. Assuming everything else remains unchanged, the higher the ROE and profit retention, the higher the growth rate of a company compared to companies that don't necessarily bear these characteristics.
Fugro's Earnings Growth And 20% ROE
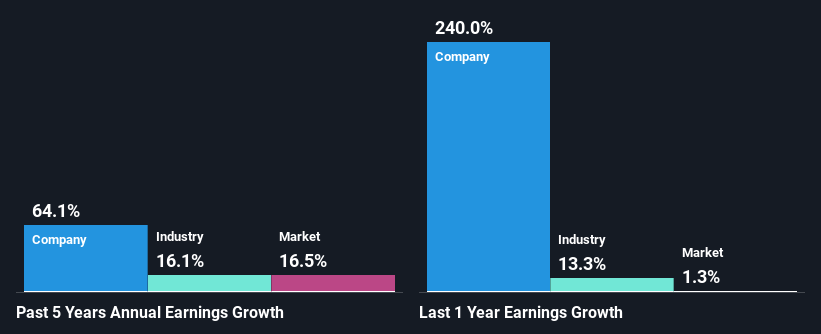
To start with, Fugro's ROE looks acceptable. Further, the company's ROE compares quite favorably to the industry average of 13%. This certainly adds some context to Fugro's exceptional 64% net income growth seen over the past five years. We reckon that there could also be other factors at play here. Such as - high earnings retention or an efficient management in place.
Next, on comparing with the industry net income growth, we found that Fugro's growth is quite high when compared to the industry average growth of 16% in the same period, which is great to see.
Earnings growth is an important metric to consider when valuing a stock. It’s important for an investor to know whether the market has priced in the company's expected earnings growth (or decline). Doing so will help them establish if the stock's future looks promising or ominous. Is Fugro fairly valued compared to other companies? These 3 valuation measures might help you decide.
Is Fugro Using Its Retained Earnings Effectively?
Fugro has a really low three-year median payout ratio of 18%, meaning that it has the remaining 82% left over to reinvest into its business. So it seems like the management is reinvesting profits heavily to grow its business and this reflects in its earnings growth number.
Upon studying the latest analysts' consensus data, we found that the company's future payout ratio is expected to rise to 36% over the next three years. Consequently, the higher expected payout ratio explains the decline in the company's expected ROE (to 15%) over the same period.
Conclusion
On the whole, we feel that Fugro's performance has been quite good. Particularly, we like that the company is reinvesting heavily into its business, and at a high rate of return. Unsurprisingly, this has led to an impressive earnings growth. Having said that, the company's earnings growth is expected to slow down, as forecasted in the current analyst estimates. To know more about the company's future earnings growth forecasts take a look at this free report on analyst forecasts for the company to find out more.
Valuation is complex, but we're helping make it simple.
Find out whether Fugro is potentially over or undervalued by checking out our comprehensive analysis, which includes fair value estimates, risks and warnings, dividends, insider transactions and financial health.
View the Free AnalysisHave feedback on this article? Concerned about the content? Get in touch with us directly. Alternatively, email editorial-team (at) simplywallst.com.
This article by Simply Wall St is general in nature. We provide commentary based on historical data and analyst forecasts only using an unbiased methodology and our articles are not intended to be financial advice. It does not constitute a recommendation to buy or sell any stock, and does not take account of your objectives, or your financial situation. We aim to bring you long-term focused analysis driven by fundamental data. Note that our analysis may not factor in the latest price-sensitive company announcements or qualitative material. Simply Wall St has no position in any stocks mentioned.
About ENXTAM:FUR
Fugro
Provides geo-data services for infrastructure, energy, and water industries in Europe, Africa, the Americas, the Asia Pacific, the Middle East, and India.
Flawless balance sheet and undervalued.

