Stock Analysis
- South Korea
- /
- Semiconductors
- /
- KOSDAQ:A031980
PSK HOLDINGS Inc.'s (KOSDAQ:031980) Stock's On An Uptrend: Are Strong Financials Guiding The Market?


Most readers would already be aware that PSK HOLDINGS' (KOSDAQ:031980) stock increased significantly by 64% over the past three months. Since the market usually pay for a company’s long-term fundamentals, we decided to study the company’s key performance indicators to see if they could be influencing the market. Specifically, we decided to study PSK HOLDINGS' ROE in this article.
Return on equity or ROE is a key measure used to assess how efficiently a company's management is utilizing the company's capital. In other words, it is a profitability ratio which measures the rate of return on the capital provided by the company's shareholders.
Check out our latest analysis for PSK HOLDINGS
How Is ROE Calculated?
ROE can be calculated by using the formula:
Return on Equity = Net Profit (from continuing operations) ÷ Shareholders' Equity
So, based on the above formula, the ROE for PSK HOLDINGS is:
13% = ₩43b ÷ ₩341b (Based on the trailing twelve months to December 2023).
The 'return' is the income the business earned over the last year. That means that for every ₩1 worth of shareholders' equity, the company generated ₩0.13 in profit.
What Has ROE Got To Do With Earnings Growth?
So far, we've learned that ROE is a measure of a company's profitability. Based on how much of its profits the company chooses to reinvest or "retain", we are then able to evaluate a company's future ability to generate profits. Assuming all else is equal, companies that have both a higher return on equity and higher profit retention are usually the ones that have a higher growth rate when compared to companies that don't have the same features.
PSK HOLDINGS' Earnings Growth And 13% ROE
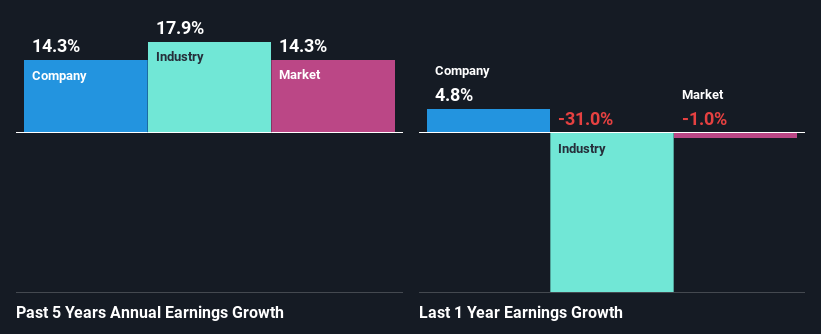
At first glance, PSK HOLDINGS seems to have a decent ROE. Further, the company's ROE compares quite favorably to the industry average of 6.8%. Probably as a result of this, PSK HOLDINGS was able to see a decent growth of 14% over the last five years.
Next, on comparing with the industry net income growth, we found that PSK HOLDINGS' reported growth was lower than the industry growth of 18% over the last few years, which is not something we like to see.
Earnings growth is an important metric to consider when valuing a stock. What investors need to determine next is if the expected earnings growth, or the lack of it, is already built into the share price. Doing so will help them establish if the stock's future looks promising or ominous. If you're wondering about PSK HOLDINGS''s valuation, check out this gauge of its price-to-earnings ratio, as compared to its industry.
Is PSK HOLDINGS Making Efficient Use Of Its Profits?
In PSK HOLDINGS' case, its respectable earnings growth can probably be explained by its low three-year median payout ratio of 24% (or a retention ratio of 76%), which suggests that the company is investing most of its profits to grow its business.
Besides, PSK HOLDINGS has been paying dividends over a period of five years. This shows that the company is committed to sharing profits with its shareholders.
Summary
In total, we are pretty happy with PSK HOLDINGS' performance. In particular, it's great to see that the company is investing heavily into its business and along with a high rate of return, that has resulted in a respectable growth in its earnings. On studying current analyst estimates, we found that analysts expect the company to continue its recent growth streak. Are these analysts expectations based on the broad expectations for the industry, or on the company's fundamentals? Click here to be taken to our analyst's forecasts page for the company.
Valuation is complex, but we're helping make it simple.
Find out whether PSK HOLDINGS is potentially over or undervalued by checking out our comprehensive analysis, which includes fair value estimates, risks and warnings, dividends, insider transactions and financial health.
View the Free AnalysisHave feedback on this article? Concerned about the content? Get in touch with us directly. Alternatively, email editorial-team (at) simplywallst.com.
This article by Simply Wall St is general in nature. We provide commentary based on historical data and analyst forecasts only using an unbiased methodology and our articles are not intended to be financial advice. It does not constitute a recommendation to buy or sell any stock, and does not take account of your objectives, or your financial situation. We aim to bring you long-term focused analysis driven by fundamental data. Note that our analysis may not factor in the latest price-sensitive company announcements or qualitative material. Simply Wall St has no position in any stocks mentioned.
About KOSDAQ:A031980
PSK HOLDINGS
Manufactures and sells semiconductor manufacturing and flat panel display equipment worldwide.
Excellent balance sheet with reasonable growth potential.

