Stock Analysis
- South Korea
- /
- Media
- /
- KOSDAQ:A123570
eMnet Inc. (KOSDAQ:123570) Stock Is Going Strong But Fundamentals Look Uncertain: What Lies Ahead ?


Most readers would already be aware that eMnet's (KOSDAQ:123570) stock increased significantly by 18% over the past three months. However, we wonder if the company's inconsistent financials would have any adverse impact on the current share price momentum. In this article, we decided to focus on eMnet's ROE.
ROE or return on equity is a useful tool to assess how effectively a company can generate returns on the investment it received from its shareholders. Simply put, it is used to assess the profitability of a company in relation to its equity capital.
See our latest analysis for eMnet
How Do You Calculate Return On Equity?
ROE can be calculated by using the formula:
Return on Equity = Net Profit (from continuing operations) ÷ Shareholders' Equity
So, based on the above formula, the ROE for eMnet is:
4.2% = ₩3.9b ÷ ₩94b (Based on the trailing twelve months to December 2023).
The 'return' is the amount earned after tax over the last twelve months. So, this means that for every ₩1 of its shareholder's investments, the company generates a profit of ₩0.04.
What Has ROE Got To Do With Earnings Growth?
So far, we've learned that ROE is a measure of a company's profitability. Depending on how much of these profits the company reinvests or "retains", and how effectively it does so, we are then able to assess a company’s earnings growth potential. Assuming all else is equal, companies that have both a higher return on equity and higher profit retention are usually the ones that have a higher growth rate when compared to companies that don't have the same features.
eMnet's Earnings Growth And 4.2% ROE
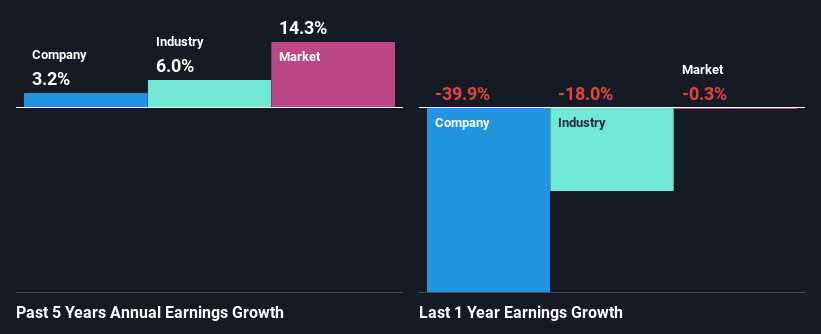
As you can see, eMnet's ROE looks pretty weak. Even when compared to the industry average of 6.3%, the ROE figure is pretty disappointing. Accordingly, eMnet's low net income growth of 3.2% over the past five years can possibly be explained by the low ROE amongst other factors.
Next, on comparing with the industry net income growth, we found that eMnet's reported growth was lower than the industry growth of 6.0% over the last few years, which is not something we like to see.
The basis for attaching value to a company is, to a great extent, tied to its earnings growth. The investor should try to establish if the expected growth or decline in earnings, whichever the case may be, is priced in. This then helps them determine if the stock is placed for a bright or bleak future. If you're wondering about eMnet's's valuation, check out this gauge of its price-to-earnings ratio, as compared to its industry.
Is eMnet Using Its Retained Earnings Effectively?
Despite having a normal three-year median payout ratio of 35% (or a retention ratio of 65% over the past three years, eMnet has seen very little growth in earnings as we saw above. So there might be other factors at play here which could potentially be hampering growth. For example, the business has faced some headwinds.
Additionally, eMnet has paid dividends over a period of four years, which means that the company's management is determined to pay dividends even if it means little to no earnings growth.
Summary
In total, we're a bit ambivalent about eMnet's performance. Even though it appears to be retaining most of its profits, given the low ROE, investors may not be benefitting from all that reinvestment after all. The low earnings growth suggests our theory correct. Wrapping up, we would proceed with caution with this company and one way of doing that would be to look at the risk profile of the business. Our risks dashboard would have the 3 risks we have identified for eMnet.
Valuation is complex, but we're helping make it simple.
Find out whether eMnet is potentially over or undervalued by checking out our comprehensive analysis, which includes fair value estimates, risks and warnings, dividends, insider transactions and financial health.
View the Free AnalysisHave feedback on this article? Concerned about the content? Get in touch with us directly. Alternatively, email editorial-team (at) simplywallst.com.
This article by Simply Wall St is general in nature. We provide commentary based on historical data and analyst forecasts only using an unbiased methodology and our articles are not intended to be financial advice. It does not constitute a recommendation to buy or sell any stock, and does not take account of your objectives, or your financial situation. We aim to bring you long-term focused analysis driven by fundamental data. Note that our analysis may not factor in the latest price-sensitive company announcements or qualitative material. Simply Wall St has no position in any stocks mentioned.
About KOSDAQ:A123570
eMnet
Operates as a professional online marketing consulting company worldwide.
Flawless balance sheet second-rate dividend payer.

